

Published: 7 May 2020
Non-subsidised rents increased most in Greater Helsinki
The rents of non-subsidised rental dwellings increased most in the year in Greater Helsinki in the first quarter of 2020.
The development of rents in non-subsidised rental dwellings, index 2015=100
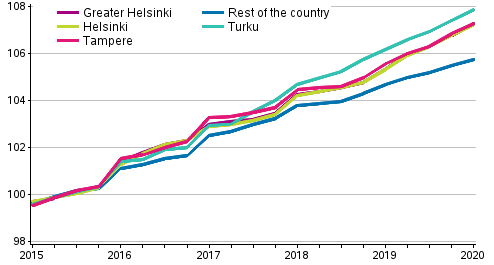
In large towns, the rents of non-subsidised rental dwellings have increased most in Helsinki, Vantaa, Turku and Tampere compared to 2015. The rise in rents was lowest in Sein�joki, Kotka and H�meenlinna. In Greater Helsinki, rents have risen by 7.3 per cent and in the rest of the country by 5.8 per cent from 2015.
Rents for non-subsidised rental dwellings, 1st quarter 2020
| Region | Index 2015=100 | Quarterly change in index, % | Yearly change in index, % | Number* | Rent per square meter (euro/m�) | Rent for new tenancies (euro/m�) |
| Whole country | 106.3 | 0.3 | 1.3 | 117 594 | 15.2 | 16.2 |
| Greater Helsinki | 107.3 | 0.5 | 1.8 | 41 998 | 19.9 | 21.3 |
| Rest of the country (whole country - Greater Helsinki) | 105.8 | 0.2 | 1.0 | 75 596 | 13.1 | 13.6 |
| Helsinki | 107.3 | 0.4 | 1.8 | 23 948 | 21.1 | 22.7 |
| Helsinki 1 | 105.9 | 0.3 | 1.5 | 3 074 | 23.1 | 26.1 |
| Helsinki 2 | 107.4 | 0.5 | 2.0 | 9 744 | 22.2 | 23.8 |
| Helsinki 3 | 105.7 | 0.4 | 1.6 | 2 957 | 19.8 | 20.2 |
| Helsinki 4 | 109.2 | 0.5 | 2.0 | 8 173 | 18.6 | 19.2 |
| Espoo-Kauniainen | 106.4 | 0.5 | 1.8 | 8 308 | 18.1 | 19.2 |
| Vantaa | 108.3 | 0.5 | 1.7 | 9 742 | 17.8 | 18.9 |
| Satellite municipalities | 106.7 | 0.3 | 1.1 | 5 097 | 14.8 | 15.4 |
| Tampere | 107.3 | 0.4 | 1.6 | 11 881 | 15.2 | 15.7 |
| Turku | 107.9 | 0.4 | 1.6 | 8 539 | 14.2 | 15.2 |
| Lahti | 104.0 | 0.1 | 0.5 | 4 282 | 13.5 | 13.7 |
| Kuopio | 106.9 | 0.1 | 0.7 | 3 721 | 14.5 | 14.6 |
| Jyv�skyl� | 105.8 | 0.1 | 0.4 | 5 730 | 14.4 | 14.6 |
| Oulu | 106.6 | 0.4 | 1.5 | 6 755 | 13.2 | 13.5 |
The average rent level of non-subsidised rental dwellings is still highest in Helsinki, EUR 21.1 per m�. In new tenancies signed in the last six months, the average price of a rented square meter was EUR 22.7 per m� in Helsinki, EUR 15.7 per m� in Tampere, and EUR 15.2 per m� in Turku.
These data derive from Statistics Finland's quarterly statistics on rents of dwellings, which is based on data from the Social Insurance Institution housing aid register and private rental housing companies.
Source: Rents of dwellings, Statistics Finland
Inquiries: Martti Korhonen 029 551 3451, Elina Peltoniemi 029 551 3088, asuminen.hinnat@stat.fi
Director in charge: Mari Yl�-Jarkko
Publication in pdf-format (229.2 kB)
- Tables
-
Tables in databases
Pick the data you need into tables, view the data as graphs, or download the data for your use.
Appendix tables
- Figures
Updated 7.5.2020
Official Statistics of Finland (OSF):
Rents of dwellings [e-publication].
ISSN=1798-1018. 1st quarter 2020. Helsinki: Statistics Finland [referred: 16.4.2024].
Access method: http://www.stat.fi/til/asvu/2020/01/asvu_2020_01_2020-05-07_tie_001_en.html