

Published: 7 November 2014
Owners of dwellings and housing companies renovated with nearly EUR six billion in 2013
The compilation of statistics on renovations to buildings and dwellings has been renewed. The statistics have not previously included own renovations or contracted renovations by owners of dwellings and renovations to public service buildings. The reasons for renovation building or data concerning the condition of buildings have not either been published earlier.
According to Statistics Finland, owners of dwellings and housing companies renovated their dwellings to the tune of EUR 5.7 billion in 2013. EUR 2.8 billion was spent on renovating detached and terraced houses. EUR 2.2 billion was used on renovations to blocks of flats, and EUR 800 million to dwellings in terraced houses. Renovations to state-subsidised rental dwelling companies were made to the value of EUR 480 million.
Most of the renovations to blocks of flats, EUR 1.6 billion, were used on renovations made by housing companies and the remaining EUR 600 million on own renovations or contracted renovations by owners of dwellings in blocks of flats. Terraced house companies used EUR 440 million on renovations and owners of terraced houses EUR 340 million.
The value of own work was not taken into account in renovations made by dwelling owners. Good one-third of those having renovated their dwelling in a block of flats, two-thirds of those having renovated their dwelling in a terraced house, and one-half of those having renovated their dwelling in a detached house reported having carried out nearly one-half of the workload of the renovation themselves.
Renovation costs by type of house and structural element in 2013, EUR million
| Structural element | Type of house | |||
| Detached and semi-detached houses | Terraced houses | Blocks of flats | All | |
| Damp areas | 385 | 116 | 247 | 749 |
| Kitchen | 336 | 96 | 170 | 602 |
| Living and other areas | 563 | 127 | 193 | 883 |
| Outer surfaces and structures | 652 | 240 | 618 | 1 510 |
| Building technology | 607 | 132 | 757 | 1 496 |
| Yard area and outbuildings | 248 | 38 | 66 | 352 |
| Indoor areas of the housing company | 0 | 27 | 128 | 154 |
| Total | 2 790 | 776 | 2 178 | 5 745 |
Renovation costs relative to the floor area amounted to EUR 46.5 per m� in blocks of flats in 2013. The corresponding cost item was EUR 34.0 per m� in terraced houses and EUR 21.7 per m� in detached houses.
The share of residential buildings included in the population of the statistics account for around 60 per cent of the floor area of the building stock in the whole country.
Except for state-subsidised rental dwelling companies, statistics on the renovation of buildings and dwellings were renewed starting from the data for 2013. The data are not comparable with the earlier released data on renovation building. In future, database tables published with the old method will no longer be updated.
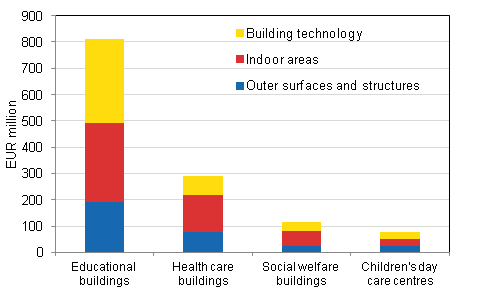
Majority of renovation costs of public service buildings went to educational buildings
EUR 1.3 billion were used on renovations to public service buildings in 2013. Educational buildings were renovated to the value of EUR 810 million, health care buildings with EUR 290 million, social welfare buildings with EUR 120 million, and children's day care centres with EUR 80 million.
EUR 530 was spent on renovations to indoor areas of public service buildings, EUR 450 million on building technology, and EUR 320 on outer surfaces and structures.
Relative to the floor area of buildings, the renovation costs of public service buildings were closer to each other. In educational buildings and health care buildings, renovation costs were EUR 65 per m�. In social welfare buildings, the figure was EUR 54 per m� and in day care centres EUR 53 per m�.
The share of educational buildings, health care buildings and social welfare buildings included in the population of the statistics account for around six per cent of the floor area of the building stock in the whole country.
Renovation costs of public service buildings by structural element in 2013, EUR million
Examined by the decade of construction, renovation costs were highest for public service buildings completed in the 1970s, EUR 330 million and EUR 86 per m�. The corresponding figures for public services buildings completed in the 1960s were EUR 300 million and EUR 84 per m�. In service buildings completed in the 1980s, the renovation cost relative to floor area was highest, the total costs being EUR 320 million and costs relative to the floor area EUR 115 per m�.
Renovation costs of public service buildings by decade of construction in 2013
| Year of construction | EUR mil. | EUR per m� |
| –1959 | 234 | 39.7 |
| 1960-1969 | 296 | 83.9 |
| 1970-1979 | 331 | 86.2 |
| 1980-1989 | 321 | 114.8 |
| 1990-1999 | 69 | 34.0 |
| 2000- | 46 | 18.7 |
| Total/average | 1 298 | 63.2 |
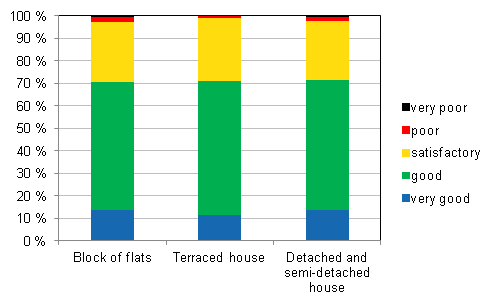
Condition of residential buildings
Those living in owner-occupied dwellings consider their residential buildings to be mainly in good condition. Regardless of whether the owner-occupied dwelling is situated in a terraced house or in a block of flats, over 70 per cent of the respondents think their residence is at least in good condition. Independent of the type of house, only at most two per cent of the respondents reckoned their house was in bad or very bad condition.
Condition evaluation of residential buildings, percentage of respondents
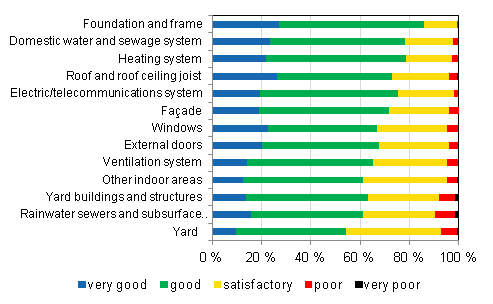
People living in detached and semi-detached houses were asked about their opinion about the condition of different structural elements and systems as well as yard areas and structures. For each inquired data, one-half of the respondents estimated the condition was good or very good. In the respondents' view, the foundation and frame, domestic water and sewerage system and heating system were in the best condition, over one-quarter of the respondents considered them to be in good or very good condition. Areas and structures outside the house were in the worst condition.
Condition evaluation of detached and semidetached houses, percentage of respondents
Source: Renovation of buildings and apartments. Statistics Finland
Inquiries: Eetu Toivanen 029 551 3331, Atte Lintil� 029 551 2914, rakennus.suhdanne@stat.fi
Director in charge: Hannele Orjala
Publication in pdf-format (269.6 kB)
- Tables
-
Tables in databases
Pick the data you need into tables, view the data as graphs, or download the data for your use.
Appendix tables
- Figures
-
- Appendix figure 1. Reasons for renovations to dwellings and detached houses, percentage of respondents (7.11.2014)
- Appendix figure 2. Reasons for renovations to health care buildings and educational buildings, percentage of respondents (7.11.2014)
- Appendix figure 3. Reasons for renovations to housing companies, percentage of respondents (7.11.2014)
- Appendix figure 4. Condition evaluation of public service buildings, percentage of respondents (7.11.2014)
- Appendix figure 5. Condition evaluation of housing companies, percentage of respondents (7.11.2014)
Updated 7.11.2014
Official Statistics of Finland (OSF):
Renovation building [e-publication].
ISSN=1799-2974. Renovation of buildings and apartments 2013. Helsinki: Statistics Finland [referred: 23.4.2024].
Access method: http://www.stat.fi/til/kora/2013/02/kora_2013_02_2014-11-07_tie_002_en.html