

Published: 8 May 2014
Lower volume of goods transported by lorries in 2013 than in the previous year
Measured by tonnes, eight per cent less goods were transported by lorries in domestic and international transport in 2013 than in the previous year. Tonne-kilometres decreased by four per cent. These data derive from the statistics on goods transport by road compiled by Statistics Finland.
Domestic transport
In 2013, lorries transported 269 million tonnes of goods in domestic transport, which was eight per cent less than one year before. The total length of transport journeys driven was 1.9 billion kilometres, which was one per cent more than in 2012. The total number of tonne-kilometres was 21 billion, which was four per cent less than in the year before. Tonne-kilometre describes the volume of transport and is obtained as a product of the transported volume of goods given in tonnes and the length of the transport journey in kilometres.
Annual volume of goods transported by lorries in domestic transport
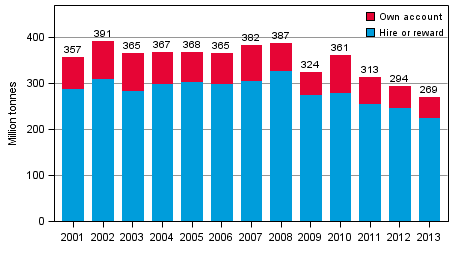
Professional or licensed transport accounted for 84 per cent of the tonnes of all transported goods, which was in line with the year before. The share of licensed transport was 94 per cent of all tonne-kilometres, which was one percentage point more than in the year before.
The share of goods transport by road by lorries with a total weight of over 60 tonnes of all transported goods measured in tonnes grew from zero per cent in 2012 to four per cent in 2013. The reason for this is probably that previously the highest permitted total weight was 60 tonnes, which could only be exceeded with special exemption, so only lorries with special exemption belonged to the category of lorries with a total weight of over 60 tonnes. The situation changed at the beginning of October 2013 when a new decree raised the highest permitted total weight of combination vehicles, and as a result new lorries were registered in the category of lorries with a total weight of over 60 tonnes. It should be noted that the decree increased the number of lorries in the category of lorries with a total weight of over 60 tonnes only for the last quarter of the 2013 statistics, so we can assume that the share of lorries with a total weight of over 60 tonnes in goods transport will increase further in 2014.
Measured by type of goods, 86 million kilometres of gravel and other soil materials (Appendix table 9, category 23) was transported, which was four per cent of all kilometres. Due to the heaviness of soil materials this type of goods was transported most when measured by weight, 40 per cent of all transported tonnes. Despite the large volume of tonnes, transport of soil materials made up only ten per cent of the tonne-kilometres, because the average transport journey for soil materials is short. Measured in tonne-kilometres, most transported goods were saw timber and pulpwood (category 6), 11 per cent of all tonne-kilometres. Measured in kilometres, empty lorries (category 44) were transported most, 26 per cent of all kilometres.
The average transport journey was 58 kilometres in 2013, which was one kilometre more than one year earlier. The average transport journey was 16 kilometres for soil materials and 100 kilometres for saw timber and pulpwood. The average length of empty journeys was 39 kilometres, which was one kilometre less than one year earlier.
International transport
In 2013, lorries transported 5.2 million tonnes of goods in international transport, which was ten per cent less than one year before. The transport performance totalled 3.5 billion tonne-kilometres, which was two per cent less than in 2012.
It should be noted that the statistics on goods transport by road always monitor the transport performance of a truck tractor selected to the survey during the survey period. The truck tractor selected to the sample may have several different trailers during the survey period. Therefore, if trailers are hauled to a harbour from which they continue in sea transport without the truck tractor, the monitoring of the transport ends there.
Source: Goods Transport by Road 2013, Statistics Finland
Inquiries: Mikko Simonaho 09 1734 2789, liikenne.matkailu@stat.fi
Director in charge: Hannele Orjala
Publication in pdf-format (184.8 kB)
- Tables
-
Tables in databases
Pick the data you need into tables, view the data as graphs, or download the data for your use.
Updated 8.5.2014
Official Statistics of Finland (OSF):
Goods transport by road [e-publication].
ISSN=2342-3617. 2013. Helsinki: Statistics Finland [referred: 19.4.2024].
Access method: http://www.stat.fi/til/kttav/2013/kttav_2013_2014-05-08_tie_001_en.html