

1. Holding gains boosted households’ financial assets in 2013
Households' financial assets grew by EUR 15 billion in 2013. As a result of a rise in share prices, households accrued a total of EUR 12 billion in holding gains. In addition, households' net investments in financial assets amounted to EUR three billion. Because the growth in financial assets was larger than that in borrowing, households' net financial assets increased.
Figure 1. Change in financial assets of households, EUR billion
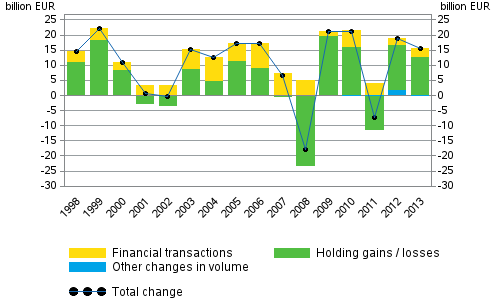
In 2013, households favoured cash deposits and mutual fund shares in their investments. By contrast, households withdrew assets from fixed-term deposits. The shift from fixed-term deposits to cash deposits has continued since the first half of 2012.
Overall, households’ financial assets amounted to EUR 252 billion at the end of 2013. Of these, EUR 80 billion were deposits, EUR 58 billion unquoted shares and equity, EUR 47 billion insurance and pension technical reserves, EUR 30 billion quoted shares, and EUR 17 billion mutual fund shares. The value of other financial assets held by households was EUR 19 billion. Households' shares in housing companies are not recorded in financial accounts as financial assets
Households' debts continued to grow but clearly more slowly than in earlier years. Households' loan debt increased by good EUR three billion during 2013, reaching EUR 127 billion at the end of the year. The indebtedness rate, i.e. the proportion of loans relative to disposable income, rose by 0.9 percentage points to 118.1 per cent. Because households' financial assets increased more than their debts, households' net financial assets grew and amounted to EUR 116 billion at the end of the year.
1.1. General government’s financial position improved
General government's financial position improved in 2013. At the end of the year, the general government sector's net financial assets amounted to EUR 110 billion, which was EUR eight billion more than one year earlier. The improved financial position is explained by an increase of EUR 11 billion in the financial assets of employment pension schemes that belong to social security funds. Simultaneously, the net financial assets of central government decreased by EUR 0.6 billion and that of local government by over one billion.
The weakening of the financial position of central government that began in 2008 continued, but now more slowly than in previous years. During 2013, central government's net financial assets contracted by EUR 0.6 billion to EUR -48 billion. In 2012, net financial assets decreased by EUR eight billion. The main reason behind the declining net financial assets was an increase in the stock of bonds. During the year, gross debt at market prices in the financial accounts of the central government grew by EUR two billion.
During 2013, net financial assets of employment pension schemes increased from EUR 147 billion to EUR 157 billion. The increase in the net financial assets of employment pension schemes is partially explained by the favourable development of stock market prices. As the market value of quoted shares and mutual fund shares grew, employment pension schemes accrued a total of EUR five billion in holding gains. Similarly, net investments amounted to nearly EUR six billion. In 2013, employment pension schemes' investments focused on long-term debt securities and mutual fund shares.
1.2. Non-financial corporations decreased debt financing
Non-financial corporations' debt financing decreased during 2013. This happened last in 2009. Debt financing refers to the total of loan debts and financing in the form of debt securities. Over the year, non-financial corporations' loan debt decreased from EUR 168 billion to EUR 163 billion. The decrease in loans was partially compensated by financing in the form of debt securities, as non-financial corporations issued debt securities to the net amount of EUR three billion.
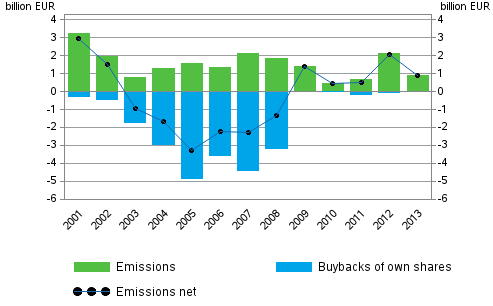
Non-financial corporations were to some extent interested in acquiring financing through issuing new equity on the stock market in 2013. Quoted enterprises issued new shares to the total value of close on EUR one billion. However, emissions decreased compared to the year before. Buybacks of own shares have been minimal since 2009. From 2003 to 2008, non-financial corporations amortised their share debt by buying back more of their own shares than issuing them.Figure 2. Changes in emissions of quoted shares by non-financial corporations, EUR billion
1.3. Growth in domestic mutual funds continued
Domestic mutual funds grew by a total of EUR eight billion in 2013. Approximately one-half of the growth is explained by net investments. The second half is caused by holding gains from investment funds. Financial and insurance corporations invested most eagerly in investment funds during the year. Net investments by households, general government and non-financial corporations in investment funds were also positive.
1.4. Foreign deposits were withdrawn from Finland
Foreign net investments to Finland were EUR 14 billion negative. This is mainly explained by foreign deposits being withdrawn from Finnish banks. If deposits are not taken into account, foreign net investments to Finland amounted to EUR ten billion.
Foreign investors increased their holdings in Finnish debt securities and quoted shares last year. At the end of the year, the value of the ownership of foreign quoted shares was EUR 72 billion. The proportion of foreign ownership of the value of Finnish quoted shares also made an upturn after a drop of several years and stood at 47 per cent at year-end.
Foreign bonds and quoted shares interested Finns in 2013. At the end of the year, Finnish units owned EUR 55 billion worth of foreign quoted shares and EUR 80 billion worth of domestic quoted shares. By contrast, Finns invested clearly less in foreign investment funds than in previous years.
A considerable change took place in Finnish deposits abroad as the central bank withdrew EUR 49 billion of its foreign deposits. The central bank's foreign deposits thus returned close to the level that prevailed prior to the steep rise that took place in late 2011. Loans to the rest of the world were, like in the year before, granted by deposit banks.
1.5. Development in private sector debt moderate
Private sector debt grew by EUR two billion last year. Simultaneously, the GDP share of the debt fell by 0.9 percentage points to 169.9 per cent. Private sector debt comprises the loan debts and debts in the form of debt securities of non-financial corporations, households and non-profit institutions serving households.Figure 3. Non-consolidated private sector debt as percentage of GDP
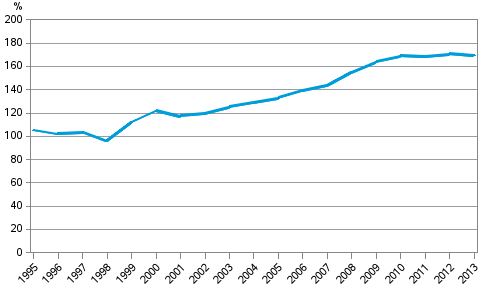
The European Commission has launched a mechanism for the monitoring of macroeconomic imbalance (Macroeconomic Imbalance Procedure), which is based on eleven indicators. One of the indicators is private sector debt as percentage of GDP. Private sector debt comprises the loan debts and debts in the form of debt securities of non-financial corporations, households and non-profit institutions serving households.
Source: Financial Accounts, Statistics Finland
Inquiries: Saara Roine 029 551 2922, rahoitus.tilinpito@stat.fi
Director in charge: Leena Storg�rds
Updated 15.9.2014
Official Statistics of Finland (OSF):
Financial accounts [e-publication].
ISSN=1458-8145. 2013,
1. Holding gains boosted households’ financial assets in 2013
. Helsinki: Statistics Finland [referred: 18.4.2024].
Access method: http://www.stat.fi/til/rtp/2013/rtp_2013_2014-09-15_kat_001_en.html