

Published: 9 March 2018
Industrial output grew in January both year-on–year and from the previous month
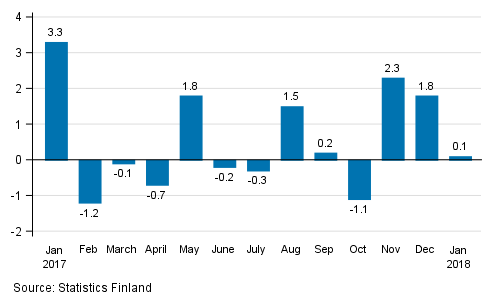
Seasonally adjusted industrial output (TOL BCD) grew by 0.1 per cent in January from the previous month. According to Statistics Finland, output of total industries adjusted for working days was 4.8 per cent higher in January 2018 than in January 2017.
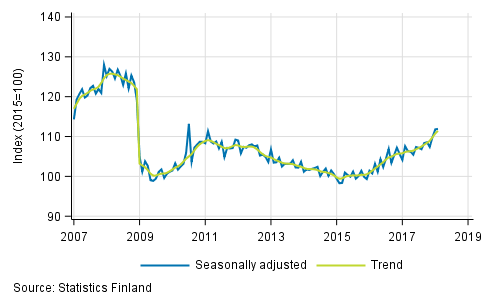
Trend and seasonally adjusted series of industrial output (BCD), 2007/01 to 2018/01
Seasonally adjusted output went up by 0.1 per cent in January from the month before. In December, seasonally adjusted output grew by 1.8 per cent from November.
Seasonally adjusted change in industrial output (BCD) from previous month, %, TOL 2008
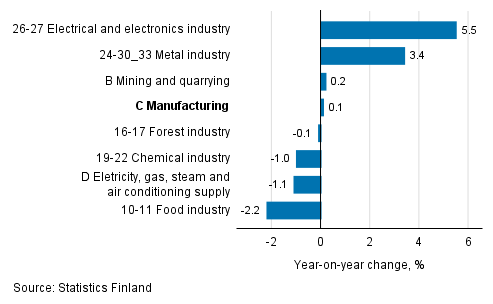
Examined by main industry, seasonally adjusted industrial output increased most in January in the electrical and electronics industry, 5.5 per cent. In January, seasonally adjusted output went up by 3.4 per cent from the previous month. Output declined most, by 2.2 per cent, in the food industry.
Seasonal adjusted change in industrial output by industry, 12/2017 to 01/2018, %, TOL 2008
Revised data for January 2018 will be published at 9 am on 10 April 2018 in connection with the release of industrial output data for February 2018. The revision is influenced by the estimation used in the latest release, which concerns the Tax Administration's self-assessed tax data used for enterprises with fewer than 50 employees. Because of the method used, seasonally adjusted figures for previous months may change even if the original figures do not become revised. The seasonally adjusted figures will also be adjusted for working days.
The base year 2015=100 is utilised for the calculation of the Volume Index of Industrial Output starting from the statistics for January 2018. Data calculated with the new base year are now released for the first time. The data for previous years have been changed to correspond to the new base year.
Industry-specific capacity utilisation rate data and data on industry E Water supply; sewerage, waste management and remediation activities are no longer produced. Here, total industry refers to industries BDC.
The calculation method was changed to correspond better to the recommendations of Eurostat, the Statistical Office of the European Union. The data were previously calculated with the so-called over-the-year method. Now they are calculated with the so-called annual overlap method. More detailed information can be found in the methodological description (only in Finnish).
Source: Volume Index of Industrial Output 2018, January. Statistics Finland
Inquiries: Kari Rautio 029 551 2479, Maarit M�kel� 029 551 3324, volyymi.indeksi@stat.fi
Director in charge: Sami Saarikivi
Publication in pdf-format (347.4 kB)
- Reviews
- Tables
-
Tables in databases
Pick the data you need into tables, view the data as graphs, or download the data for your use.
- Figures
-
- Appendix figure 1. Three months' year-on-year change in manufacturing (C) sub-industries adjusted for working days (TOL 2008) (9.3.2018)
- Appendix figure 2. Trend series of manufacturing sub-industries, 2007/01 to 2018/01, TOL 2008 (9.3.2018)
- Appendix figure 3. Seasonally adjusted industrial output Finland, Germany, Sweden, France and United Kingdom (BCD) 2007 to 2018, TOL 2008 (9.3.2018)
Updated 9.3.2018
Official Statistics of Finland (OSF):
Volume index of industrial output [e-publication].
ISSN=1798-9272. January 2018. Helsinki: Statistics Finland [referred: 19.4.2024].
Access method: http://www.stat.fi/til/ttvi/2018/01/ttvi_2018_01_2018-03-09_tie_001_en.html