

Published: 9 June 2020
Private sector cost of an hour worked increased by 1.0 per cent in January to March year-on-year
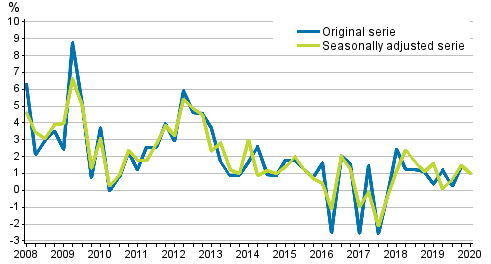
According to Statistics Finland, private sector labour costs increased by 1.0 per cent in January to March 2020 when compared with the respective period of the year before. Seasonally adjusted labour costs went up by 1.0 per cent in January to March 2020. In the first quarter of 2020, the number of working days was the same as in the corresponding period of 2019.
Year-on-year change in labour costs in the private sector from the corresponding quarter of the previous year
In the private sector, labour costs without one-off pay items, such as performance-based bonuses, increased by 0.3 per cent in January to March 2020 compared to the corresponding quarter one year ago. The rise in costs was mainly due to the fall in the number of hours worked. Over the same period, the index of wage and salary earnings for the private sector went up by 1.6 per cent.
In the central government sector, the cost of an hour worked increased by 0.5 per cent in January to March 2020 when compared with the respective period of the year before. The year-on-year change in labour costs without one-off pay items was a 0.2 per cent increase. Seasonally adjusted labour costs went up by 0.5 per cent. The rise in costs was mainly due to the growth in wages and salaries subject to preliminary withholding tax. The number of hours worked also increased, but the costs increased more. Over the same quarter, the index of wage and salary earnings in the central government sector went up by 3.0 per cent.
In the local government sector, the cost of an hour worked decreased by 0.2 per cent in January to March 2020 when compared with the respective period of the year before. The year-on-year change in labour costs without one-off pay items was a of 1.0 per cent increase. There was no change in the seasonally adjusted labour costs. The decrease in costs is mainly due to the fact that the hours worked have increased more than the costs. Over the same period, the index of wage and salary earnings in the local government sector went up by 2.3 per cent.
The exceptional situation caused by the coronavirus did not have a significant effect on the Labour Cost Index in the first quarter, as the resulting layoffs did not start until late March.
Year-on-year change in labour costs according to industry (TOL 2008) and sector, 1st quarter 2020
| Code | Industry/Sector | Labour costs, year-on-year change |
||
| Labour costs | Labour costs, without one-off pay items |
Labour costs, seasonally adjusted | ||
| B to S | Total, private sector | 1,0 | 0,3 | 1,0 |
| B to E | Manufacturing | 2,8 | 2,2 | 2,7 |
| F | Construction | -0,2 | 0,6 | 0,0 |
| G to N | Business service activities | 0,3 | -0,7 | 0,3 |
| J to R | Central government | 0,5 | 0,2 | 0,5 |
| D to S | Local government | -0,2 | 1,0 | 0,0 |
Changes by industry
The cost per an hour worked went up by 2.8 per cent in manufacturing industries (B to E) and by 0.3 per cent in business service activities (G to N) in January to March 2020 compared with the corresponding period last year. The cost went down by 0.2 per cent in construction (F).
In manufacturing industries in the first quarter of 2020, there was a rise in costs of 3.1 per cent in the chemical industry and a rise of 2.3 in the food industry. In the forest industry, costs went up by 3.4 per cent and 2.9 per cent in the metal industry. Among service industries, the biggest rise in costs, 2.5 per cent, was in financial and insurance activities. In wholesale and retail trade, the costs went down by 1.8 per cent.
The seasonally adjusted cost of an hour worked in all manufacturing (B to E) went up by 2.7 per cent in January to March 2020 compared with the corresponding period last year. In construction (F), there was no change in the seasonally adjusted cost of an hour worked and in business service activities (G to N) the cost increased by 0.3 per cent.
In manufacturing industries, seasonally adjusted cost of an hour worked went up by 3.1 per cent in the chemical industry, 2.4 percent in the food industry, 2.9 per cent in the forest industry and 3.0 per cent in the metal industry in the January to March period of 2020 from the same period of the previous year. In business service activities, seasonally adjusted costs rose by 2.2 per cent in financial and insurance activities. In wholesale and retail trade, the costs went down by 1.8 per cent.
The Labour Cost Index measures the change in wage and salary costs calculated per hour worked
The Labour Cost Index measures the change in wage and salary costs calculated per hour worked. Hours actually worked refer to the working hours an employee has spent on his/her actual duties. Hours worked include Sunday and overtime work but not paid hours off work, like the hours of annual leaves, national holidays or paid sickness absences.
In the index, hours worked or the structure of personnel have not been standardised. The cost of an hour worked is calculated directly as the ratio of industry-specific wages and salaries sum and social insurance contributions to the hours worked for each quarter. The change in average labour costs is affected by changes in regular earnings, performance-based bonuses and other one-off pay components, social insurance contributions, as well as changes in the number of hours worked and the structure of the labour force.
Starting from the first quarter of 2019, the wages and salaries sum of the labour cost index is based on the Incomes Register. Due to this change, there may be some uncertainty in the wages and salaries sum, which has an effect on the statistics.
Source: Wages, Salaries and Labour Costs, Statistics Finland
Inquiries: Pekka Haapala 029 551 3460, Tanja Jumisko 029 551 3695, Katri Lepikk� 029 551 3233, Tuomas Lahti 029 551 3299, Matti Lahdenm�ki 029 551 3690, tvkindeksi@stat.fi
Director in charge: Mari Yl�-Jarkko
Publication in pdf-format (304.0 kB)
- Tables
-
Tables in databases
Pick the data you need into tables, view the data as graphs, or download the data for your use.
Appendix tables
- Appendix table 1. Labour costs, Labour Cost Index 2016=100 (9.6.2020)
- Appendix table 2. Labour costs, percentage changes, Labour Cost Index 2016=100 (9.6.2020)
- Appendix table 3. Labour costs, excluding one-off items, Labour Cost Index 2016=100 (9.6.2020)
- Appendix table 4. Labour costs, excluding one-off items, percentage changes, Labour Cost Index 2016=100 (9.6.2020)
- Appendix table 5. Seasonally adjusted labour costs in private sector by industry (TOL 2008). Labour Cost Index 2016=100 (9.6.2020)
- Appendix table 6. Seasonally adjusted labour costs, percentage changes, Labour Cost Index 2016=100 (9.6.2020)
- Appendix table 7. Standard Industrial Classification 2008 (9.6.2020)
- Revisions in these statistics
-
- Revision of data (9.6.2020)
Updated 9.6.2020
Official Statistics of Finland (OSF):
Labour cost index [e-publication].
ISSN=1798-3746. 1st quarter 2020. Helsinki: Statistics Finland [referred: 19.4.2024].
Access method: http://www.stat.fi/til/tvki/2020/01/tvki_2020_01_2020-06-09_tie_001_en.html