

1. The calculation methods of the Consumer Price Index have been revised
Statistics Finland has made revisions to the calculation methods of the Consumer Price Index. The Index will start using an annual chain index with seasonally adjusted weights. The revision is based on adoption of harmonised compilation methods with the Harmonised Index of Consumer Prices. Year 2010 remains as the base year of the Consumer Price Index.
The price development of selected commodities is monitored in the Index. With the help of annually updated commodities and weights, better representation of commodities in the Index is ensured. Previously, the weight structure of the Consumer Price Index has been updated in scheduled updates every five years. The previous revision was made from the beginning of 2011, when a larger proportion of commodities were changed. Now, for instance, snacks, dress fabric, and maintenance and repair of entertainment electronics were added as new commodities to the Index. The television license was removed from the Index as it became a direct tax. This revision does not affect the development of the Index.
1.1. The weight structure corresponds with consumption in 2012
The 2013 weight structure of the Consumer Price Index 2010=100 is based on National Accounts data concerning the year 2011, which have been updated to correspond with the value of private consumption in 2012. In 2012, household consumption according to the Consumer Price Index amounted to EUR 93.4 billion, the value of the consumption in 2010 at current prices was EUR 83.3 billion. In the previous base year of 2005 the value of consumption was EUR 70.4 billion, and in 2000, respectively, EUR 56.5 billion.
In future, the weight structure will be revised annually using the national accounts figures from two years earlier or other more recent data on consumption shares. The new weight structure will take effect starting from the Index for January of each year.Figure 1. Comparison of weight structures of Consumer Price Indices 2010=100, 2005=100 and 2000=100, per cent
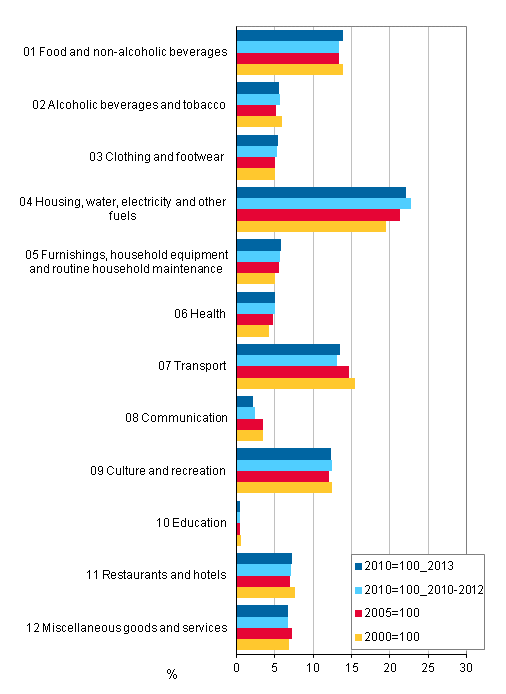
The biggest change in the weight structure of the Index from 2010 to 2013 is that the weight share for the housing commodity group has decreased. This means that changes in the prices of the commodities in this group have a smaller impact on the Consumer Price Index than before. Similarly, as the weight shares of food and transport increase, changes in the prices of these commodity groups affect the Consumer Price Index more than before.
Even if the consumption share has remained the same or even decreased, the amount of consumption of a commodity can have increased as prices have fallen. For instance, the consumption of mobile phones grew from 2005 to 2010 but their prices went down considerably over the same period, which meant that their weight share in the overall Index decreased. From 2010 to 2012, the prices of mobile phones continued decreasing but the amount of mobile phones bought went up remarkably, which increased their weight in the overall Index. The weight share of the communication group was depressed most by the decrease in landline connections and the price drop in mobile phone services.Figure 2. Changes in private consumption volume in 2010-2012 at 2012 prices
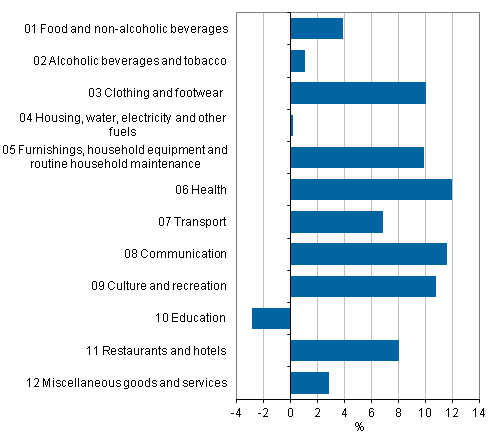
Figure 2 shows the changes in private consumption volumes from 2010 to 2012 by the main commodity groups of the Consumer Price Index at 2012 prices. Even though, according to Figure 2, the volume of health care has grown by nearly 12 per cent from 2010 to 2012, the overall weight of the group has not changed much due to a decrease in prices.
Because the Consumer Price Index depicts a pure change in prices, improved quality is also visible as a growth in volume in Figure 2. If, for instance, the same number of computers is still purchased as before and they have the same price, but their quality has improved, their index in the Consumer Price Index will decrease. This is visible as a change in the volume when studying consumption structures.
1.2. Processing of seasonal products changes
Previously, all commodities have been included monthly in the calculation of the Consumer Price Index with their annual sales weight. The indices of seasonally sold commodities, like winter clothes, have, after the sales season that ends the selling season of the products been returned to the level that prevailed before the sales season. Outside the season, the indices have been included in the calculation at their weights.
From the beginning of 2013, the weight of so-called seasonal commodities, like summer and winter sports equipment, will vary depending on the season. After the sales season, the index will still be returned to the level that prevailed before the sales season, the weight of the commodity in question is set to zero and the euros are divided to other commodities within the same group. The method is described in more detail under Article 2, paragraph 6 of the Commission Regulation (330/2009) "class-confined seasonal weights index".
The methodological change applies to commodity groups 01.1.6 Fruit and berries, 03.1.2 Clothing, 03.1.3 Accessories and other clothing items, 03.2.1 Footwear, 07.2.1 Spare parts and equipment for private vehicles, and 09.3.2 Sports gear and camping equipment, of the Consumer Price Index. Because the weight of seasonal commodities in the Consumer Price Index is relatively small, the methodological change has no effect on inflation figures. The method has been in use in the Harmonised Index of Consumer Prices from the beginning of 2012.
1.3. The revision does not interrupt the time series of the Cost-of-living Index
The latest consumer price indices are suitable for short-term examinations. The Cost-of-living Index 1951:10=100 is a long time series calculated by chaining from the latest Consumer Price Index (currently Consumer Price Index 2010=100) and its development, therefore, follows the Consumer Price Index.
Many rents, such as those on dwellings, business premises or land, are usually tied to the Cost-of-living Index. From the user’s point of view, the Cost-of-living Index is the most practical, because index revisions do not interrupt the series, and the point figures of the Cost-of-living Index are published monthly at the same time as the Consumer Price Index.
1.4. Harmonised Indices of Consumer Prices remained unchanged
The methodological changes made to the Consumer Price Index at this time have already been adopted in the Harmonised Index of Consumer Prices and in the Harmonised Index of Consumer Prices at Constant Prices from the beginning of 2012.
In addition to their national indices, the Member States of the European Union also produce a Harmonised Index of Consumer Prices. Based on these, Eurostat, the Statistical Office of the European Communities, calculates the European Index of Consumer Prices and the Monetary Union Index of Consumer Prices. Calculation of the Harmonised Index of Consumer Prices is guided by EU Regulations.
The main purpose for which the Harmonised Index of Consumer Prices is used is inflation comparison between the EU countries. The European Central Bank uses the Harmonised Index of Consumer Prices as the measure of inflation in its monetary policy.Figure 3. The weight structure of the Harmonised Index of Consumer Prices 2005=100 in 2011-2013, per cent
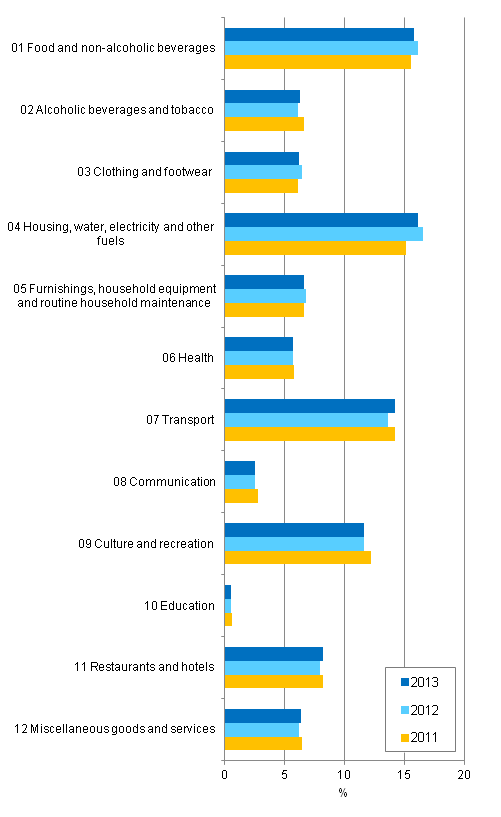
The Finnish Harmonised Indices of Consumer Prices are mainly based on the same price data and national accounts data as the Finnish national Consumer Price Index. The development of the Harmonised Indices of Consumer Prices deviates from that of the national consumer price indices, because they include fewer commodities. In the Harmonised Indices of Consumer Prices, the concept of consumption excludes owner-occupancy, games of chance, interests and tax-like payments. They cover under 90 per cent of the national Consumer Price Index.
Table 1. Items excluded from the Harmonised Index of Consumer Prices found in the national Consumer Price Index and their weight shares in 2013
| COICOP | Commodity group | Weight in the CPI, o/o |
| 04.2 | Owner-occupied housing | 7,90 |
| 07.2.4.2.1.1 | Vehicle tax | 1,00 |
| 09.4.3.1.1.1 | Games of chance | 2,00 |
| 12.5.2.1.1.2 | Premium for fire insurance on detached houses | 0,05 |
| 12.6.2.1.1.2 | Interests on consumer credits | 1,10 |
| Items excluded from HICP, total | 12,05 | |
Source: Consumer Price Index, Statistics Finland
Inquiries: Juhani Pekkarinen 09 1734 3476, Johanna Leivo 09 1734 3397, Mari Yl�-Jarkko 09 1734 3310, khi@stat.fi
Director in charge: Leena Storg�rds
Updated 19.2.2013
Official Statistics of Finland (OSF):
Consumer price index [e-publication].
ISSN=1799-0254. January 2013,
1. The calculation methods of the Consumer Price Index have been revised
. Helsinki: Statistics Finland [referred: 18.4.2024].
Access method: http://www.stat.fi/til/khi/2013/01/khi_2013_01_2013-02-19_kat_001_en.html