

Published: 19 September 2018
Current account showed a deficit in the second quarter, the net international investment position weakened
The current account was in deficit in the second quarter of 2018. Exports of goods and services in balance of payments terms grew by 6 per cent year-on-year and the balance sheet of goods and services was slightly in surplus. The current account deficit increased from the year before as the deficit of the primary income account grew. The net international investment position weakened. The data appear from Statistics Finland's statistics on balance of payments and international investment position.
Current account and goods and services account
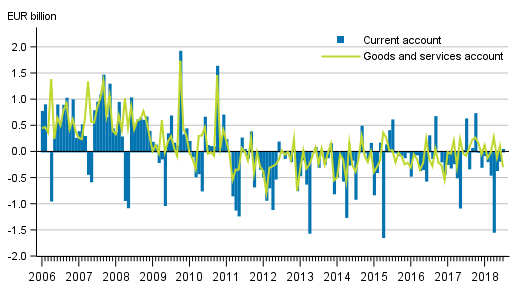
Current account
In the second quarter of 2018, the current account was EUR 2.1 billion in deficit. Of the sub-items of the current account, the primary income account was EUR 1.8 billion in deficit. The balance sheet of goods and services was EUR 0.3 billion in surplus and the secondary income account EUR 0.6 billion in deficit.
Goods and services
The trade account in balance of payments terms was EUR 1.0 billion in surplus in the second quarter of 2018. In the corresponding quarter of the previous year, the trade account was EUR 0.6 billion in surplus. The service account showed a deficit of EUR 0.7 billion in the second quarter of 2018.
In balance of payments terms, goods exports grew by 6 per cent from the corresponding quarter of the year before. Goods imports grew by 3 per cent from one year ago. The value of goods exports was EUR 16 billion and the value of goods imports EUR 15 billion.
In the second quarter of 2018, service exports grew by 7 per cent and service imports similarly by 7 per cent compared to the corresponding quarter of the previous year. Service exports rose to EUR 6.8 billion and service imports to EUR 7.5 billion. The deficit of the service account increased due to the deficit of EUR 0.8 billion in the travel balance. Travel expenditure from Finland to abroad grew by 11 per cent in the second quarter and travel receipts to Finland fell by 1 per cent compared to the corresponding quarter last year. More detailed import and export figures in balance of payments terms by service item and area can be found in the statistics on international trade in goods and services starting from 2015. Decreases and increases made to the Finnish Customs figures, which result in goods trade in balance of payments terms, are also broken down in the statistics on international trade in goods and services.
Primary income in the second quarter and revisions of annual data
The primary income account was EUR 1.8 billion in deficit in the second quarter of 2018. One year earlier, the deficit of the primary income account in the second quarter was EUR 0.9 billion.
Primary income for 2017 was revised from the preliminary data released in March. The revised primary income for 2017 is EUR 0.1 billion in deficit. In the data released in March, primary income for 2017 was EUR 2.7 billion in surplus. The revision of primary income was due to revisions in the source data concerning the non-financial corporations sector. As a result of the fallen primary income, the current account for 2017 also turned EUR 1.5 billion into deficit.
The primary income account includes compensation of employees, investment income and other primary income paid from Finland to abroad and from abroad to Finland. The deficit of primary income is mainly due to investment income, which includes returns on capital like interests and dividends.
Current account in balance in July 2018
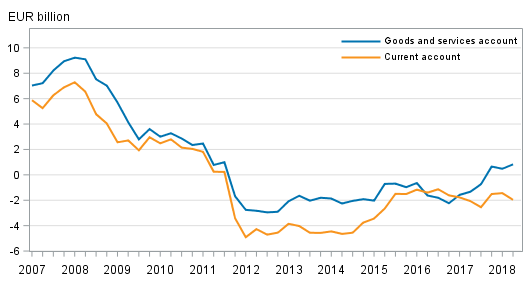
The current account was in balance in July. The value of goods exports in balance of payments terms grew by 1 per cent from twelve months back. Of the sub-items of the current account, the primary income account was in surplus. The trade account in balance of payments terms, the service account and the secondary income account were in deficit.
Finland’s current account and goods and services account, 12 –month moving sum
Financial account and net international investment position
Net international investment position weakened
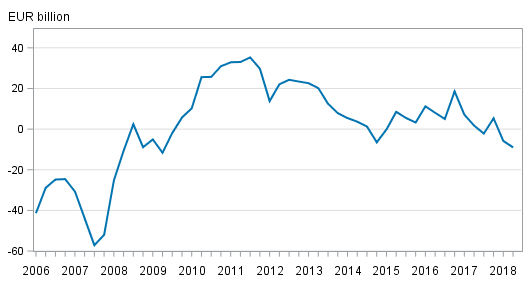
At the end of the second quarter of 2018, Finland had EUR 631.7 billion in foreign assets on gross and EUR 640.6 billion in foreign liabilities on gross. The net international investment position, that is, the difference between the stock of assets and liabilities, was thus EUR 9.0 billion negative as there were more liabilities than assets. The net investment position contracted compared to the end of the previous quarter, when the net international investment position was EUR -5.9 billion. Both the stock of foreign assets and liabilities increased in the second quarter, but liabilities grew more than assets.
Examined by sector, the weaker net investment position of non-financial corporations had most effect on the net international investment position in the second quarter of 2018. Social security funds had the biggest foreign net assets, EUR 144.6 billion, and the other monetary financial institutions sector held the largest foreign net liabilities.
Finland’s net international investment position quarterly. The figure was corrected on 19 September 2018.
Capital flowed to Finland as portfolio investments
In the second quarter of 2018, net capital inflow to Finland amounted to EUR 3.7 billion, which weakened the net international investment position. Examined by type of investment, net capital inflow was mostly in the form of portfolio investments, EUR 7.2 billion. Portfolio investments include bonds, money market instruments and shares. Net capital outflow from Finland was mostly in the form of direct investments, EUR 3.9 billion.
At the end of the second quarter of 2018, international direct investment assets on gross stood at EUR 154.2 billion and the corresponding liabilities at EUR 119.8 billion, as a result of which the investment position of direct investments was EUR 34.4 billion positive at the end of the second quarter.
The net investment position of portfolio investments weakened in the second quarter of 2018, as the liabilities stock of portfolio investments grew more than assets. Portfolio investment assets amounted to EUR 319.8 billion at the end of the second quarter of 2018. Valuation changes increased portfolio investment assets from the first quarter, as assets in the form of financial transactions decreased. Portfolio assets were most in the form of bonds and mutual fund shares. The stock of portfolio investment liabilities grew from the first quarter as a result of financial transactions and valuation changes and was EUR 323.6 billion at the end of the second quarter of 2018. Bonds were the biggest item in portfolio investment liabilities, their stock being EUR 173.8 billion at the end of the second quarter. Portfolio investment liabilities grew most in listed shares in the second quarter.
Liabilities of other investments, such as loans from outside the group, deposits and trade credits, were EUR 47.9 billion on net larger than assets. The net liabilities grew from the first quarter as net capital inflow to Finland amounted to EUR 0.8 billion. At the end of the second quarter of 2018, assets as other investments amounted to EUR 127.2 billion and liabilities to EUR 175.0 billion.
At the end of the second quarter of 2018, Finland had EUR 0.4 billion in net liabilities related to derivatives. Liabilities related to derivatives grew from the first quarter and were EUR 22.2 billion at the end of the second quarter of 2018. Finland had EUR 21.9 billion in assets related to derivatives at the end of the second quarter of 2018.
Financial account in July 2018
In July, net capital outflow from Finland amounted to EUR 0.4 billion. Of the sub-items of the financial account, net capital outflow was mostly in the form of direct investments, EUR 1.6 billion. Net capital inflow was mostly in the form of other investments, EUR 1.7 billion.
Source: Balance of payments and international investment position, Statistics Finland
Inquiries: Tapio Kuusisto 029 551 3318, Hanna Bj�rklund 029 551 3296, balanceofpayments@stat.fi.
Director in charge: Ville Vertanen
Publication in pdf-format (326.2 kB)
- Tables
-
Tables in databases
Pick the data you need into tables, view the data as graphs, or download the data for your use.
Appendix tables
- Appendix table 1. Current account, quarterly 2018, EUR million (19.9.2018)
- Appendix table 2. External net financial transactions by sector, quarterly 2018, EUR million (19.9.2018)
- Appendix table 3. Net international investment position by sector, quarterly 2018, EUR million (19.9.2018)
- Appendix table 4. Balance of payments, EUR million (19.9.2018)
Updated 14.09.2018
Official Statistics of Finland (OSF):
Balance of payments and international investment position [e-publication].
ISSN=2342-348X. July 2018. Helsinki: Statistics Finland [referred: 20.4.2024].
Access method: http://www.stat.fi/til/mata/2018/07/mata_2018_07_2018-09-19_tie_001_en.html