

1. Gross domestic product at previous year’s levels, gross fixed capital formation decreasing
In the July to September period of 2014, the seasonally adjusted volume of Finland’s gross domestic product increased by 0.2 per cent from the previous quarter. Adjusted for working days, gross domestic product was 0.1 per cent up on the third quarter of 2013. Calculated at current prices, gross domestic product adjusted for working days was 1.3 per cent higher than one year ago.
Figure 1. Volume change of GDP from the previous quarter, seasonally adjusted, per cent
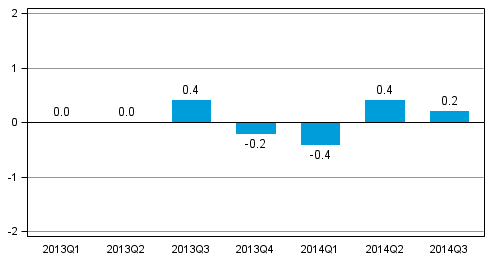
No growth or downward trend can still be detected in the volume of the gross domestic product, In January to September 2014, 0.1 per cent less GDP has been accumulated than in the corresponding period last year. If the volume of the gross domestic product remains at the level of the third quarter in the fourth quarter (seasonally adjusted), the GDP accumulation for the whole year will be almost exactly the same as last year.
According to preliminary data compiled by Eurostat, GDP in the EU-28 area grew by 0.3 per cent in the third quarter of 2014 compared to the previous quarter.
1.1. Production
The volume of total value added generated by all industries grew by 0.1 per cent from the previous quarter and was on level with twelve months back.
Figure 2. Changes in the volume of value added generated by industries in the third quarter of 2014 compared to one year ago (working day adjusted, per cent)
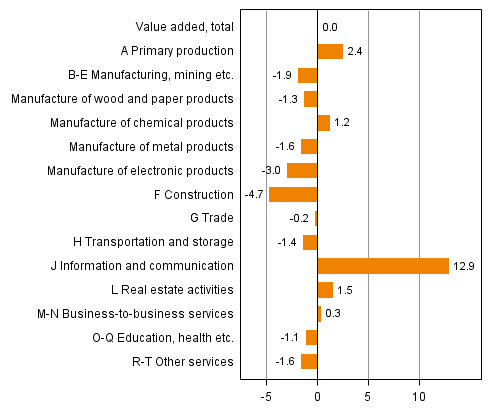
Figure 3. Changes in the volume of value added generated by industries in the third quarter of 2014 compared to the previous quarter (seasonally adjusted, per cent)
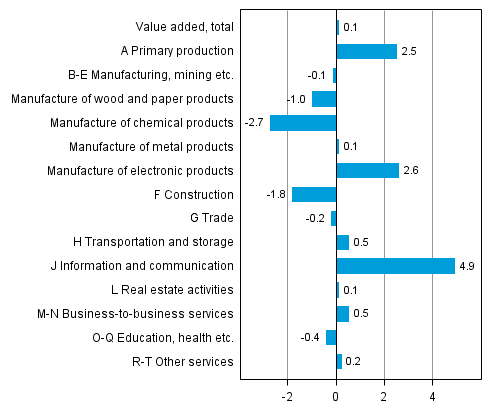
In primary production, that is, agriculture, forestry and fishing, the volume of value added grew in the third quarter by 2.5 per cent from the previous quarter and by 2.4 per cent from one year previously. According to the Ministry of Agriculture and Forestry's Crop Production Statistics, the total grain crop was good this year and wheat crop rose to over one billion kilos for the first time.
Industrial output did not grow in July to September. The value added in industry B to E was 0.1 per cent down on the previous quarter and 1.9 per cent down on the respective quarter twelve months back. Output in manufacturing (C) contracted by 0.2 per cent from the previous quarter and by 1.5 per cent year-on-year.
In the July to September period, output in construction diminished by 1.8 per cent from the previous quarter and by 4.7 per cent from one year back.
Value added in services went up by 0.4 per cent from the previous quarter and by 0.9 per cent from the quarter twelve months back. The volume in services was boosted particularly by information and communication services and financial intermediation. Compared with the previous quarter, value added in private services grew by 0.9 per cent but the volume of public services fell by 0.7 per cent.
Value added in trade was 0.2 per cent lower than in the previous quarter and in the third quarter of 2013.
1.2. Imports, exports, consumption and gross fixed capital formation
In the third quarter of 2014, total demand declined by 0.6 per cent from the previous quarter and by 0.9 per cent from twelve months back. Low gross fixed capital formation in buildings and machinery lowered demand in the national economy.
Figure 4. Changes in the volume of main supply and demand items in the third quarter of 2014 compared to one year ago (working day adjusted, per cent)
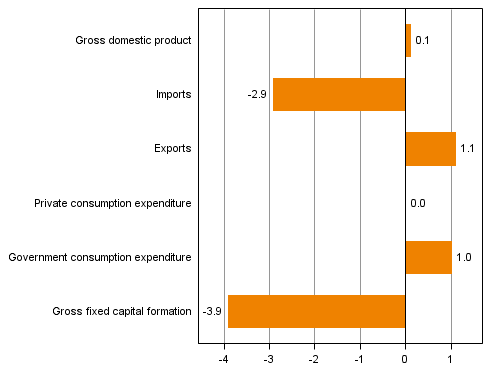
Figure 5. Changes in the volume of main supply and demand items in the third quarter of 2014 compared to the previous quarter (seasonally adjusted, per cent)
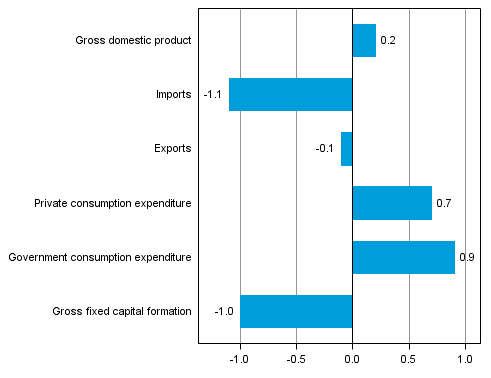
The volume of exports decreased by 0.1 per cent from the previous quarter but increased by 1.1 per cent year-on-year. Exports of goods grew by 1.6 per cent but those of services fell by 0.2 per cent year-on-year.
Imports declined by 1.1 per cent from the previous quarter and by 2.9 per cent year-on-year. Imports of goods decreased by 4.2 per cent but those of services grew by 0.4 per cent year-on-year.
In the third quarter, the volume of private consumption grew by 0.7 per cent from the previous quarter and was at the same level as twelve months back. Public consumption expenditure grew by 0.9 per cent from the previous quarter and by one per cent from the corresponding quarter last year.
Gross fixed capital formation fell by one per cent from the previous quarter and by 3.9 per cent year-on-year. Gross fixed capital formation in construction diminished by 2.2 per cent from the previous quarter and by 5.2 per cent year-on-year. The volume of investments in machinery, equipment and transport equipment decreased by 0.3 per cent from the previous quarter and by 4.4 per cent year-on-year.
1.3. Employment, wages and salaries and national income
In the third quarter, the number of employed persons contracted by 0.3 per cent from the previous quarter. The number of employed persons was 0.1 per cent higher than one year earlier. The number of hours worked in the national economy increased by 0.6 per cent from the previous quarter and by 1.1 per cent from one year back.
According to Statistics Finland’s Labour Force Survey, the rate of unemployment for the July to September period was 7.5 per cent. In the corresponding period of last year it stood at 7.1 per cent.
In the July to September period, the nominal wages and salaries bill of the national economy grew by 0.4 per cent from the previous quarter and by 1.2 per cent year-on-year. Social contributions paid by employers increased by 2.9 per cent from last year.
GDP calculated at current prices was 0.2 per cent lower than one year previously.
1.4. The available data
These preliminary data on the third quarter of 2014 are based on the source information on economic development that had become available by 27 November 2014.
The annual level data for 1990 to 2013 correspond with the National Accounts data released on 30 September 2014, except for those on the rest of the world sector (imports, exports, primary income from/to the rest of the world), which may have become revised.
Data concerning the last quarter of 2014 will be released on 2 March 2015, when the data for earlier quarters will also be revised. A flash estimate on GDP development for October to December will be released in connection with the Trend Indicator of Output on 13 February 2015.
Due to the benchmarking and seasonal adjustment methods, quarterly data in the entire time series may become slightly revised in connection with each release. However, the largest revisions take place during the two to three years following the release on a quarter, because final annual accounts data are published at a lag of around two years from the end of the statistical reference year. Seasonally adjusted and trend time series always become revised against new observations irrespective of whether the original time series becomes revised or not.
The quality description can be accessed at (in Finnish): http://www.tilastokeskus.fi/til/ntp/laa.html .
Methodological description of Quarterly National Accounts .
Source: National Accounts 2014, 3rd quarter. Statistics Finland
Inquiries: Pasi Koikkalainen 029 551 3332, Veli-Pekka Karvinen 029 551 2667, kansantalous.suhdanteet@stat.fi
Director in charge: Leena Storg�rds
Updated 5.12.2014
Official Statistics of Finland (OSF):
Quarterly national accounts [e-publication].
ISSN=1797-9765. 3rd quarter 2014,
1. Gross domestic product at previous year’s levels, gross fixed capital formation decreasing
. Helsinki: Statistics Finland [referred: 20.4.2024].
Access method: http://www.stat.fi/til/ntp/2014/03/ntp_2014_03_2014-12-05_kat_001_en.html