

1. Review of the third quarter 2012 data by sector
1.1. The disposal income of households increased due to higher wages, salaries and received social benefits
The disposable income of households grew in the third quarter of 2012 by 3.1 per cent compared to the corresponding quarter in 2011. The key components of disposal income on the income side are wages, salaries, entrepreneurial income and property income and social benefits. The biggest expense items are taxes paid and social contributions. Compared to the figures one year ago, the income improved in particular due to a EUR 0.5 billion increase in wages and salaries and a EUR 0.7 billion increase in social benefits.
Figure 1. Components of household sector adjusted disposable income
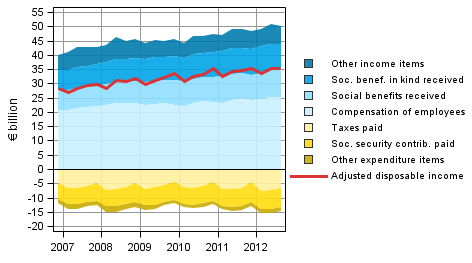
When received social benefits in kind are added to the disposable income of households, the household adjusted disposable income is derived, which is the indicator recommended by the OECD for measuring economic well-being. Social benefits in kind refer, for instance, to education, health and social services. The adjusted disposable income grew by 2.7 per cent compared to the corresponding quarter last year.
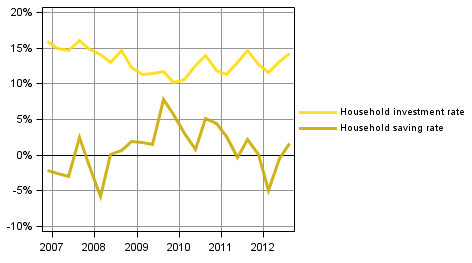
In the third quarter of 2012, households' saving rate was 1.7 per cent of the disposable income. One year previously, the saving rate was 2.3 per cent. The saving rate is derived by deducting consumption expenditure from disposable income. The saving rate can be negative if households' consumption expenditure is higher than the disposable income. In the third quarter of 2012, the investment rate of households accounted for 14.2 per cent of disposable income. One year ago, the investment rate was slightly higher, 14.6 per cent. Most of households' investments were investments in dwellings.
Figure 2. Households' indicators
Wages and salaries paid by non-profit institutions serving households grew by nearly two per cent in the third quarter of 2012 compared to one year ago.
In this statistic, the households sector only covers the actual households sector S14. Sector S15, non-profit institutions serving households is calculated and published separately. The households sector in Eurostat’s publications also includes the data for sector 15. Another difference is that Eurostat publishes investment and savings rates as gross figures, i.e. including consumption of fixed capital. This statistics uses net data, i.e. consumption of fixed capital has been removed from the figures.
1.2. The profit share of non-financial corporations weakened from last year
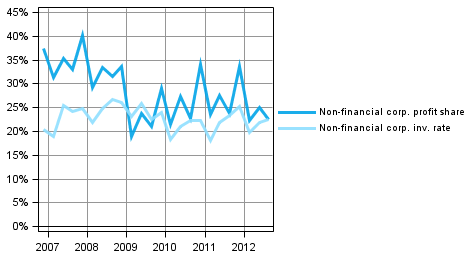
In the third quarter of 2012, the profit share of non-financial corporations, or the share of operating surplus of the value added, was 22.5 per cent. One year previously, the corresponding figure was 23.7 per cent. The profit share decreased heavily at the end of 2008 and has grown moderately since then. During 2012, the trend seems to have made a downturn. The profit share is mainly determined based on the development of value added. Compensation of employees developed more evenly so the fluctuations in value added are visible in profits. The investment rate of non-financial corporations, or the proportion of fixed capital investments in value added, was 22.6 per cent in the third quarter of 2012. One year ago, the figure was slightly higher, 23.4 per cent.
Figure 3. Non-financial corporations' indicators
Net lending that describes the financial position of enterprises has been positive for a long time. This means that the non-financial corporations sector as a whole has financed its investments with its own surplus. During the 2009 recession, net lending of the non-financial corporations sector increased, which can be due to it becoming more difficult to obtain loans or to a lower willingness to obtain loans. In the third quarter of 2012, non-financial corporations’ net lending was three per cent of the GDP.
For the financial and insurance sector, the third quarter of 2012 was tinged with the effects of a low interest level. The low interest level was visible in the property income and expenditure of the sector, both of which decreased by 14 per cent over the year, and as a drop in net interest income. Lower interest income and increased intermediate consumption depressed the added value in the sector, which decreased by nine per cent compared to one year ago. The operating surplus of financial and insurance corporations decreased in the third quarter of 2012 by 20 per cent from the corresponding quarter last year. Despite the decrease, the profit share of the sector was 35 per cent. Holding gains and losses generated through own securities trading are not visible in the operating surplus and profit share; they describe the income that is generated from offering financial services to the public. In terms of financial position, the financial and insurance sector is principally a lender, which was also the case in the third quarter of 2012.
1.3. General government deficit continued growing
In the third quarter of 2012, general government unconsolidated revenue grew by EUR 0.5 billion from the respective quarter of the previous year. Correspondingly, unconsolidated expenditure increased by EUR 1.8 billion. The difference between revenue and expenditure, that is, the deficit (net borrowing) of general government rose by EUR 1.3 billion from the respective quarter of the year before. In the third quarter of 2012, the general government deficit (net borrowing) stood at EUR 1.1 billion. General government is comprised of central government, local government and social security funds.
Figure 4. Components of general government sector net lending
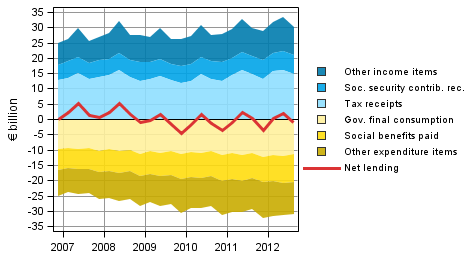
Compared to last year, net lending of the general government was weakened in particular by larger paid social contributions that grew by EUR 0.7 billion while tax income remained almost unchanged and property income decreased slightly. The deficit increased in all sub-sectors.
More detailed statistics, where the sub-sectors are specified, is published in the quarterly sector accounts of general government: http://www.stat.fi/til/jtume/index_en.html .
1.4. Foreign trade showed a surplus in the third quarter
The essential items for the rest of the world sector are the exports and imports of goods and services. Exports of goods and services at current prices amounted to EUR 19.2 billion in the third quarter of 2012. Exports remained at the same level as in the corresponding quarter last year. Exports decreased in basic metals and increased in refined oil products and electric equipment.
Figure 5. Components of the balance of goods and services in foreign trade (from the perspective of the rest-of-the-world sector)
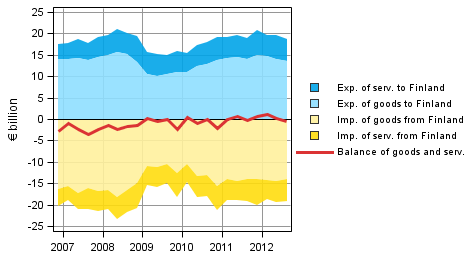
Note: Figures may differ from Bank of Finland's balance of payments figures due to differences in compilation schedules. This regards especially the latest quarters.
Imports to Finland at current prices were EUR 18.7 billion in the third quarter. In total, the value of imports decreased by EUR 0.1 billion. Imports of goods fell by EUR 0.4 billion and imports of services grew by EUR 0.3 billion. Imports decreased most for motor vehicles and the highest increase was seen for crude oil and natural gas. The balance for goods and services, which is the difference between imports and exports, showed a surplus of approximately EUR 500 million in the third quarter of 2012.
1.5. Data and methods used
The data in the publication are based on the data sources available by 12/12/2012. The data for 1999 to 2011 correspond with the annual sector accounts of the National Accounts. The quarterly data become revised as source data are updated. The biggest revision will take place for the last 2-3 years, because the data in the annual accounts are still preliminary.
The savings rate, profit share and investment rate in the quarterly publication of sector accounts are net amounts, i.e. consumption of fixed capital has been removed from the figures. The key indicators in this statistics have been calculated as follows:
Households' saving rate = B8N / (B6N+D8R)
Households' investment rate = P51K / (B6N+D8R)
Profit share of non-financial corporations = B2N / B1NPH
Investment rate of non-financial corporations = P51K / B1NPH
Source: Sector accounts, Statistics Finland
Inquiries: Jesse Vuorinen 09 1734 3363, Erkki L��k�ri 09 1734 3355, skt.95@stat.fi
Director in charge: Leena Storg�rds
Updated 4.1.2013
Official Statistics of Finland (OSF):
Quarterly sector accounts [e-publication].
ISSN=2243-4992. 3rd quarter 2012,
1. Review of the third quarter 2012 data by sector
. Helsinki: Statistics Finland [referred: 19.4.2024].
Access method: http://www.stat.fi/til/sekn/2012/03/sekn_2012_03_2013-01-04_kat_001_en.html