

Published: 15 March 2019
Small growth in the profits and investments of the non-financial corporations sector in the last quarter of 2018
Households’ saving rate grew in October to December from the previous quarter. The saving rate remained positive, because disposable income was bigger than consumption expenditure. Households’ investment rate remained on level with the previous quarter. The profit share of the non-financial corporations sector grew as value added in the sector grew more than compensation of employees. The investment rate of the non-financial corporations sector also grew slightly. These data derive from Statistics Finland’s quarterly sector accounts.
Key indicators for households and non-financial corporations, seasonally adjusted
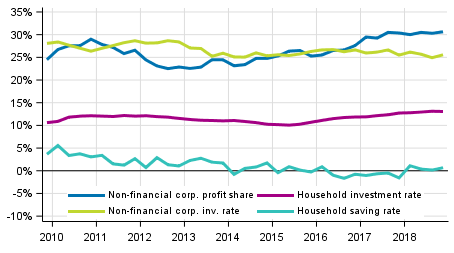
In October to December, households' saving rate grew by 0.5 percentage points to 0.7 per cent. The saving rate refers to the share of households’ savings in disposable income. Households’ investment rate was unchanged, being still 13 per cent. Most of households' investments were investments in dwellings. Households' adjusted disposable income grew by 2.8 per cent adjusted for price changes from the corresponding quarter in 2017. Adjusted income is the indicator recommended by the OECD for evaluating the economic well-being of households. Adjusted disposable income is derived by adding individual services produced by the public sector, such as education, health and social services, to the disposable income of households.
In the last quarter of 2018, the profit share of non-financial corporations, or the share of profits in value added, grew from the previous quarter by 0.4 percentage points to 30.7 per cent. The investment rate of non-financial corporations, or the proportion of investments in value added, turned to growth after weakening in the past two quarters. The investment rate was 25.6 per cent, which is 0.7 percentage points higher than in the previous quarter.
The key figures were calculated from seasonally adjusted time series. Sector accounts are calculated only at current prices. However, a volume indicator describing the development adjusted for price changes is calculated for households' adjusted disposable income in a separate Appendix table. The profit share, saving rate and investment rate are calculated from net figures, which means that consumption of fixed capital is taken into account. Households do not include non-profit institutions serving households.
Data and methods used
The quarterly data become revised as source data are updated. The biggest revisions take place for the last two to three years, because the data in the annual accounts are still preliminary. Examined by quarter, the biggest revisions occur in the release for the second quarter at the turn of September and October and in the release for the fourth quarter at the turn of March and April. These revisions are caused by updated annual national accounts data. The data in the publication are based on the data sources available by 6 March 2019. The data for 1999 to 2018 mainly correspond with the annual sector accounts of the national accounts, although the updating of source data may cause differences to the previous annual accounts release.
The saving rate, profit share and investment rate in the quarterly publication of sector accounts are net amounts, i.e. consumption of fixed capital has been removed from the figures. The key indicators in these statistics were calculated as follows:
Households' saving rate = B8N / (B6N+D8R)
Households' investment rate = P51K / (B6N+D8R)
Profit share of non-financial corporations = B2N / B1NPH
Investment rate of non-financial corporations = P51K / B1NPH
The volume indicator, measuring the development of households' adjusted disposable income, adjusted for price changes and its change percentages can be found in Appendix table 3 of this publication. This volume indicator is calculated using the price data of the statistics on quarterly national accounts, with which the components of adjusted disposable income are deflated. Households' disposable income is deflated with the implicit price index of household consumption expenditure. Price data are also available for the consumption of non-profit institutions serving households. As a methodological shortcoming, general government individual consumption expenditure has to be deflated with the total general government consumption expenditure for lack of more accurate data. The volume time series was formed with the annual overlap method.
Source: Sector accounts, Statistics Finland
Inquiries: Jarkko Kaunisto 029 551 3551, Katri Soinne 029 551 2778, kansantalous.suhdanteet@stat.fi
Director in charge: Ville Vertanen
Publication in pdf-format (389.8 kB)
- Tables
-
Tables in databases
Pick the data you need into tables, view the data as graphs, or download the data for your use.
Appendix tables
- Figures
-
- Appendix figure 1. Volume development of households adjusted disposable income (15.3.2019)
- Appendix figure 2. Households saving rate (15.3.2019)
- Appendix figure 3. Households investment rate (15.3.2019)
- Appendix figure 4. Non - financial corporations profit share (15.3.2019)
- Appendix figure 5. Non - financial corporations investment rate (15.3.2019)
- Revisions in these statistics
-
- Revisions in these statistics (15.3.2019)
Updated 15.3.2019
Official Statistics of Finland (OSF):
Quarterly sector accounts [e-publication].
ISSN=2243-4992. 4th quarter 2018. Helsinki: Statistics Finland [referred: 19.4.2024].
Access method: http://www.stat.fi/til/sekn/2018/04/sekn_2018_04_2019-03-15_tie_001_en.html