Published: 2 July 2010
Debts grew by five per cent in 2009
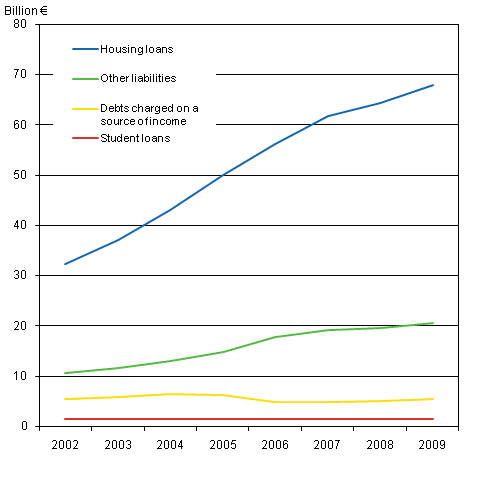
From 2002 to 2009, household-dwelling units’ debts grew by 90 per cent in real terms. At the same time housing loans grew by 110 per cent. In 2009, housing loans accounted for 71 per cent of household-dwelling units' debts, while in 2002 their share was 65 per cent. Last year, household-dwelling units’ outstanding debts totalled EUR 95 billion, of which EUR 68 billion were housing loans. There were 1.5 million indebted households and their average debt was EUR 63,780. From the previous year household-dwelling units’ debts grew by 5.3 per cent but interest expenditure went down by one-third.
Household-dwelling units ‘debts by type of debt 2002-2009, at 2009 prices

Household-dwelling units had other debts to the tune of EUR 20.5 billion. These include loans intended for the purchase of a car or free-time residence or for general consumption. In real terms such debt increased by 90 per cent from 2002. There were 1.2 million household-dwelling units with such loans and their average amount was EUR 17,560. Household-dwellings units’ business debts totalled EUR 5.4 billion, or in real terms the same as in 2002. Study loans, as well as the number of persons with them have diminished clearly. In 2009, 305,000 persons had study loans and their total amount was EUR 1.4 billion. From 2002, study loans diminished by seven per cent in real terms.
Household-dwelling units in the 25 to 34 age group had the largest housing loans: EUR 110,510 per household-dwelling unit with housing debt. Eighty-three per cent of the debts of this age group were housing debts. However, housing loans were most frequent among household-dwelling units in the 35 to 44 age group of whom 59 per cent had housing debts. More than one-half of the household-dwelling units in the 25 to 54 age group had other debts. They were most widespread among the 34 to 44 age group where almost two in three had them. The amount of other debts per indebted household-dwelling unit was EUR 17,560.
Since 2002, both debts and the number of indebted household-dwelling units grew most in Uusimaa where debts increased by 109 per cent in real terms and the number of indebted households by 24 per cent. At the same time housing debts in Uusimaa grew by 122 per cent. However, when examined per households-dwelling unit, debts grew by most in Itä-Uusimaa where they went up by 72 per cent in real terms between 2002 and 2009. Housing debts also grew by most in Itä-Uusimaa where they increased by 73 per cent in real terms per household-dwelling unit with housing debt whereas the respective figure for the whole country was 68 per cent.
Debts were smallest in Lapland, Kainuu and North Karelia, or just under EUR 50,000 per indebted household-dwelling unit. The number of indebted household-dwelling units went up by least since 2002 in the regions of Eastern and Northern Finland and in Satakunta.
Debts have gone up by clearly more than income. In 2008, households’ rate of indebtedness, i.e. ratio of debts to disposable income, was 105 per cent, having been 70 per cent in 2002. Among indebted households the respective figures were 149 and 108 per cent.
Household-dwelling units where the reference person was aged 25 to 34 were the most indebted. In 2008, their rate of indebtedness was 188 per cent. However, the rate fell by one percentage point from the year before. The rate of indebtedness declined by even more in the under-24 age group: from 91 per cent in 2007 to 86 per cent in 2008. Among the youngest household-dwelling units, income went up by more but debts by less than the average for the other age groups apart from pensioners. In 2009, too, debts grew by less in the youngest age group than in the other age groups.
Source: Indebtedness 2009. Statistics Finland
Inquiries: Timo Matala (09) 1734 3422, toimeentulo@stat.fi
Director in charge: Riitta Harala
- Tables
-
Tables in databases
Pick the data you need into tables, view the data as graphs, or download the data for your use.
Updated 2.7.2010
Official Statistics of Finland (OSF):
Indebtedness [e-publication].
ISSN=2489-3285. 2009. Helsinki: Statistics Finland [referred: 17.4.2024].
Access method: http://www.stat.fi/til/velk/2009/velk_2009_2010-07-02_tie_001_en.html

