Indicators for the circular economy business 2020
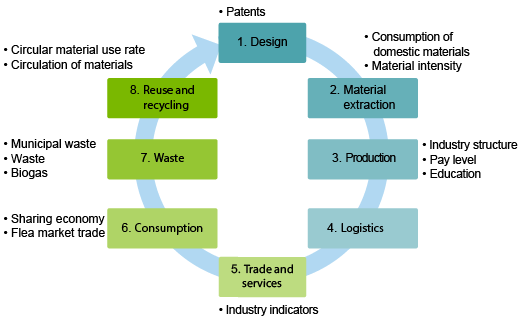
The set of indicators consists of eight activities including a total of 15 indicators. The division into activities has been made to help perception, and it should be noted that it is primarily a theoretical frame of reference that allows the specification of indicators. The division into activities is not meant to lead to strict boundaries between different indicators.
The indicators describe the circular economy business activities from different perspectives, and they are not mutually commensurable or of equal weight. The indicators should be examined as a wider whole instead of individual indicators: for example, a mere reduction in the total amount of waste or in landfill disposal tells us hardly anything about the circular economy. In many indicators, the emphasis should be on decoupling – the figure ought to be tied to economic development, for example. This way it can be ensured that the fall in the amount of waste is not caused by a contraction of the economy but by changes in the structure and procedures of the economy.
Existing data have been utilised in producing the indicators, which enables time series to extend backwards in time as well. In most of the indicators the time series covers the years 2013 to 2018, in some also more years than that. The existing long time series also allow for a limited retrospective examination of even new phenomena (such as the circular economy).
Some of the indicators have also been produced regionally, for example on the number of circular economy establishments, turnover and personnel, and flea market trade.
View the indicators
- Design
- Material extraction
- Production
- Logistic
- Trade and services
- Consumption
- Waste
- Reuse and recycling
The circular economy is a major system-level change. The transition towards a circular economy requires innovations and investments in new technologies and modes of action. The design of products, services and production chains is a precondition for promoting the circular economy.
Design is an important part of the circular economy, but it is difficult to measure. At the moment, it is possible to describe design by the number of patents related to the circular economy per one million population. Patents are not necessarily the best way to measure design and innovation activity related to the circular economy. However, statistics are already compiled on them at present and it is possible to separate circular economy activities in their classification, so they afford a good starting point for measuring.
Patents related to the circular economy
The indicator includes registered patents that can be classified as circular economy patents per one million population.
The indicator includes registered patents that can be classified as circular economy patents per one million population.
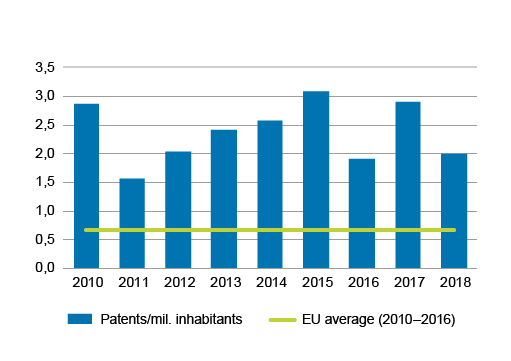
As enterprises switch to a circular economy, they should also adopt new operating modes and produce innovations. The number of patents has varied much between 2010 and 2018. However, more patents related to the circular economy have been registered in Finland every year than the European average. The EU reference value has been calculated as an average for 2010 to 2016 when Eurostat has compiled statistics on patents. The EU average has remained almost unchanged in these years.
The indicator is based on Eurostat's circular economy indicators and utilises the same definition of the Cooperative Patent Classification (CPC)(Eurostat) as Eurostat's indicators. The CPC category definition of patents comprises different patents concerning the treatment of waste and waste water, as well as patents relating to technologies that mitigate greenhouse gas emissions. The list is naturally not entirely comprehensive, but it helps to describe innovation activity related to the circular economy.
Statistics Finland does not compile statistics on patents, so the indicator data have been collected from Eurostat's database until 2016 and from the Finnish Patent and Registration Office's public Espacenet database.
In a working circular economy, the demand for natural resources as raw materials decreases as they are replaced with recycled materials. Good planning can also improve the efficiency of production processes and extend the service life of products, and these measures are also reflected in a decreasing use of virgin raw materials.
Currently, few statistical classifications distinguish the use of raw materials by source, but natural resources taken into use in the economy can be measured with domestic material use. In addition to the absolute value, the use of natural resources should be examined by proportioning it to economic growth in order to see whether changes are just a result of cyclical fluctuations in production or actual development. In terms of sustainability, the aim is to attain decoupling, whereby the use of natural resources per euro will grow more slowly than the economy or even decrease. Decoupling can be promoted by servicification of the economy and increasing the use of recycled raw materials.
Consumption of domestic materials and material intensity
The consumption of domestic materials includes materials taken into use from Finnish nature, to which the weight of imported goods is added and from which the weight of exports is subtracted. The material intensity is obtained as a ratio of domestic consumption of materials to GDP.
The use of natural resources is the use of domestic direct inputs, including materials taken from nature for further processing. When the weight of imported goods is added to direct inputs and export goods are correspondingly subtracted, the indicator domestic material consumption, or DMC, is obtained. Domestic material consumption is measured in tonnes and can be divided into four material groups: non-metallic minerals, metal ores, biomass and fossil energy materials (see material classification) in Finnish.
Domestic material consumption by material and material intensity in 2010 to 2018
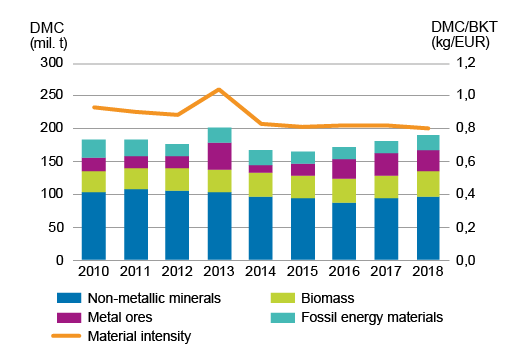
Between 2010 and 2018, domestic material consumption has varied from around 170 to 200 million tonnes. In the latest examined years, the figure has been growing slightly. On the other hand, GDP has also grown at the same time, leading to a decrease in material intensity, that is, materials have been used less relative to the volume of production. Material intensity has been falling in Finland for a long time, although in 2013, exceptionally active mining of metal ores made it rise momentarily.
When interpreting indicators related to material consumption it should be noted that for the time being, it is possible to compile statistics about international trade only on the weights of products crossing the border. Therefore, for example, the use of natural resources in the country of manufacture of the product remains largely the responsibility of that country, even if consumption took place in Finland. Correspondingly, the consumption of raw materials for export products manufactured in Finland remains mostly visible in Finnish material consumption.
Statistics Finland calculates the value of domestic material consumption as part of the annually statistics on economy-wide material flow accounts.Both domestic material consumption and material intensity are among the UN's indicators for sustainable development.
One of the objectives of the circular economy is to reduce raw material consumption and transfer production to more sustainable products and services. The aim of the production activity is to measure the realisation of the circular economy from the perspective of enterprises.
The production of the circular economy is measured with indicators on the number of circular economy establishments, turnover, personnel, pay and training. These describe the activities of the circular economy enterprises and those employed in the circular economy industries by means of educational background and pay. The activities of the circular economy are also described by area on the level of regions.
Statistical classifications do not currently separate circular economy activities. However, with the help of industries we can make some distinctions between circular economy activities and other business activities. In this way it is not possible to measure all circular economy activities in the economy, but with the present statistics and classifications the industries are a good starting point for measuring.
Number, turnover and personnel of circular economy establishments
The indicator includes the number, turnover and personnel of establishments in industries classified as circular economy industries.
Number, turnover and personnel of circular economy establishments in 2013 to 2019
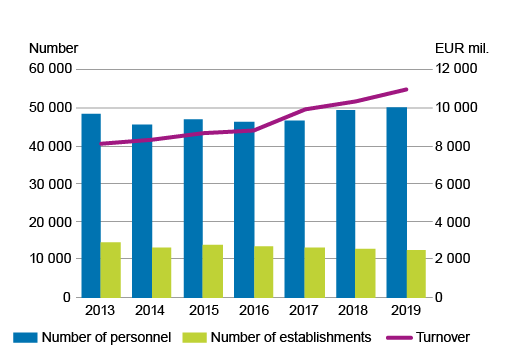
The turnover of circular economy industries has grown steadily in 2013 to 2019. The number of personnel has also grown slightly.
By contrast, the number of establishments has fallen somewhat. The indicator data have been compiled from data on establishments of enterprises. The circular economy industries have been defined for this indicator with the help of the list of industries in the appendices (see circular economy industries). The indicator includes all establishments reported to operate in the industries concerned. Thus, the indicator also covers enterprises where only part of the activity belongs to the circular economy. Only establishments with a turnover and number of employees of over 0 are included.
The indicator data have been compiled from data of Statistics Finland's structural business and financial statement statistics.
Circular economy business activity by region
The indicator includes the number, turnover and personnel of establishments in industries classified as circular economy industries by region.
Turnover of circular economy establishments by region in 2013 and 2019
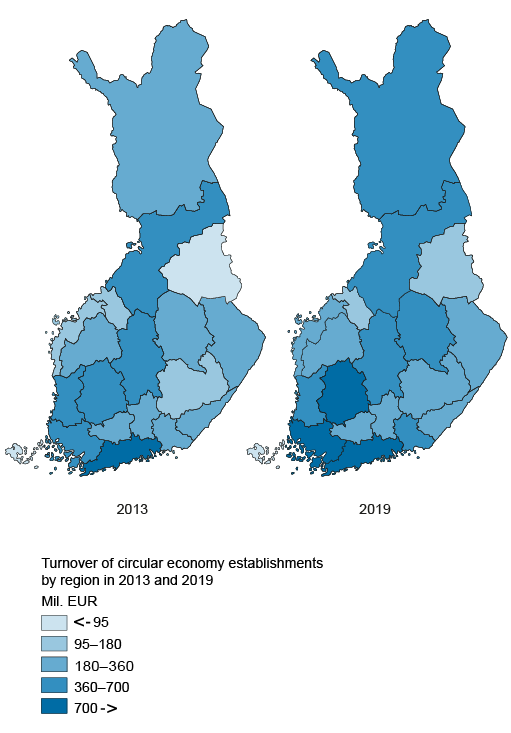
The maps illustrate the development of the turnover of circular economy establishments by region in 2013 and 2019. Turnover has grown in the whole country between the years.
The indicator data have been compiled from data of Statistics Finland's Finland's structural business and financial statement statistics.
Pay level in circular economy industries
The pay level in circular economy industries can be measured by comparing median pay in circular economy industries to the median of pay in the whole economy.
Median pay of circular economy industries and all industries in 2010 to 2018
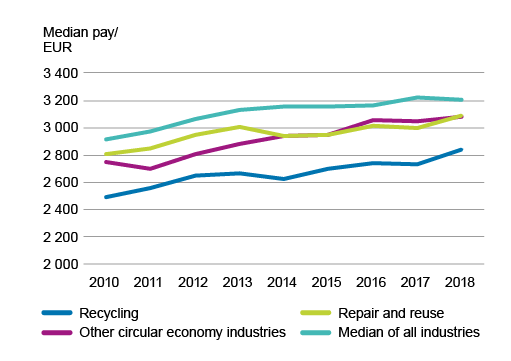
In circular economy industries, the pay development has largely followed the general pay development in 2010 to 2018. The pay medians of the circular economy are below the general pay level. In industries related to recycling, the median pay is lower than in others. The 2018 data show signs of growth in the pay medians of circular economy industries, while the growth of the general pay median halted.
The indicator was produced from the data of Statistics Finland's structure of earnings statistics.
The circular economy industries have been defined for this indicator with the help of the list of industries in the appendices (see circular economy industries).
Persons employed in circular economy industries by level of education
The education indicator describing the educational background of persons employed in circular economy industries aims to describe the jobs generated in circular economy industries.
Persons employed in circular economy industries within one year of graduation by level of education in 2010 to 2018
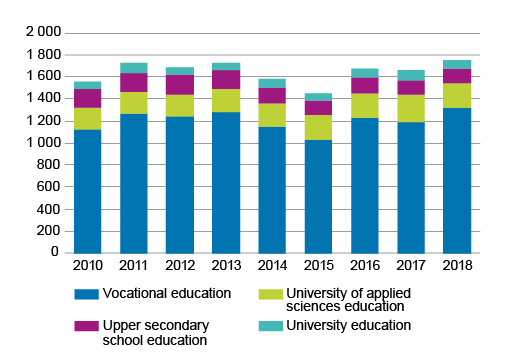
The indicator describes the level of education and numbers of persons employed in circular economy industries within one year of graduation. The numbers of persons employed in circular economy industries have remained fairly stable between 2010 and 2018. Vocational education is the most common level of education. The large share of vocational education is partly explained by the fact that the indicator describes employment within one year of graduation. The vocational level of education includes sectors of education from which students graduate straight to circular economy industries and when the indicator measures those employed within one year of graduation it is more probable for graduates from these sectors of education to find employment directly in the fields in question. From other levels of education it is possible to transfer to circular economy industries only later on after graduation, as the training programmes do not directly train for work in these sectors.
The indicator was produced from the data of Statistics Finland'sstatistics on transition from school to further education and work.
The circular economy industries have been defined for this indicator with the help of the list of industries in the appendices (see circular economy industries).
There is currently no indicator for logistics related to the circular economy. However, logistics and its planning are seen as an important part of the circular economy.
One objective in the circular economy is to reduce consumption and change consumption habits from consumption of products into consumption of services. This can be described with the share of service industries. The indicator measures the share of turnover from service industries in the whole economy.
Share of service industries
The indicator measures the share of turnover from service industries in the whole economy.
Share of turnover in service industries in the whole economy in 2013 to 2018
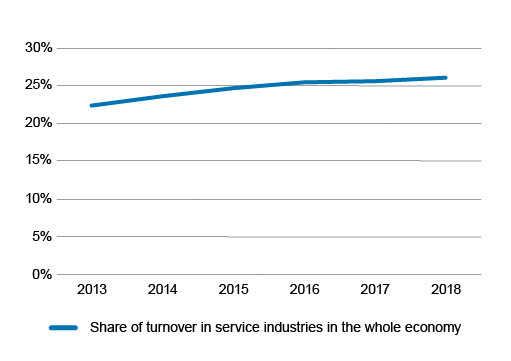
As Finland moves towards a circular economy, the share of turnover in service industries should also grow. In 2013 to 2018, the share of turnover in service industries in the entire economy has grown steadily. However, the growth has evened out starting from 2016.
The indicator was produced from the data of Statistics Finland's structural business and financial statement statistics tiedoista.The TOL2008 categories TOL2008 categories from transport and storage to other service activities (H to S, excluding category K Financial and insurance activities) are classified as service industries.
The consumption activity contains indicators intended to measure the circular economy from the perspective of consumers. Besides enterprises, consumers also play an important role in the realisation of the circular economy. Consumers' decisions also steer the activity of enterprises. Consumption comprises two indicators: sharing economy and flea market trade. Flea market trade includes enterprises' turnover, as well as the number of establishments and personnel.
Sharing economy
The indicator for the sharing economy describes households' annual average purchases and sales in different flea market types in 2019.
Households' average purchase and sales sums in different flea market types in 2019
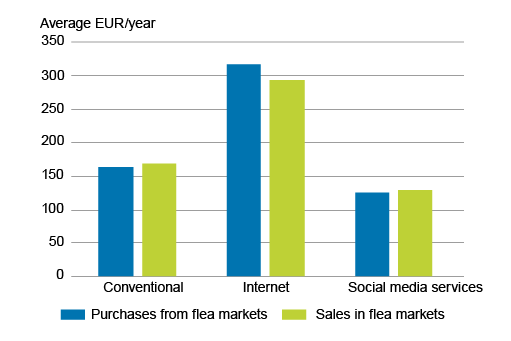
Households' purchases and sales are clearly focused on online flea markets. Conventional flea markets and social media services are almost on the same level, as the share of conventional flea markets is only slightly higher.
The indicator divides flea markets into three groups: conventional, online and social network services.
The indicator data have been collected from Statistics Finland's experimental statistics on the phenomena of the peer-to-peer and sharing economy in households (in Finnish).
Flea market trade
The flea market trade indicator describes the turnover of enterprises operating in flea market industries and their numbers of establishments and personnel.
Number, turnover and number of personnel of establishments in flea market industries in 2013 to 2019
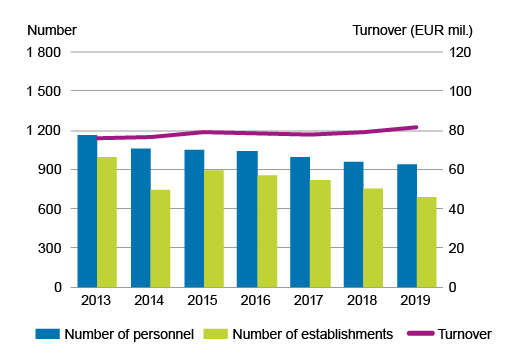
The turnover of flea market trade has grown only slightly in 2013 to 2019. The numbers of personnel and establishments have been falling steadily. The turnover of flea market trade does not directly measure the money spent or earned in flea markets, as it does not necessarily directly transfer to the turnover of the enterprise operating the flea market.
The indicator includes enterprises' establishments that operate in the following industries:
- 47791 Antiques shops
- 47792 Second-hand bookshops
- 47793 Auction houses
- 47799 Retail sale of other second-hand goods in stores
The indicator data have been compiled from data on establishments of enterprises. The indicator includes all establishments reported to operate in the industries mentioned above. Thus, the indicator also covers enterprises where only part of the activity takes place in the industries concerned. Only establishments with a turnover and number of employees of over 0 are included. Data from Åland have not been included in the indicator due to data protection.
The indicator data have been compiled from data of Statistics Finland's structural business and financial statement statistics.
Flea market trade by region
The indicator includes the turnover of enterprises operating in flea market industries and the numbers of establishments and personnel by region.
Number of flea market establishments by region in 2013 and 2019
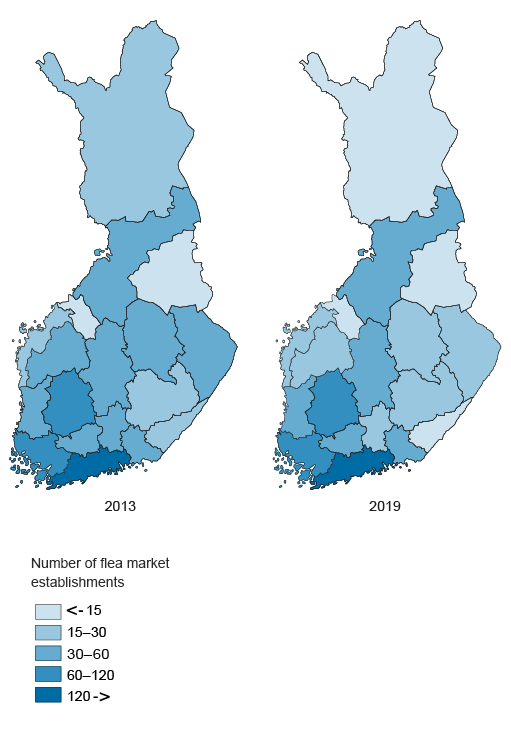
The maps illustrate the number of flea market establishments by region in 2013 and 2019. The indicator includes enterprises' establishments that operate in the following industries:
- 47791 Antiques shops
- 47792 Second-hand bookshops
- 47793 Auction houses
- 47799 Retail sale of other second-hand goods in stores
The indicator data have been compiled from data on establishments of enterprises. The indicator includes all establishments reported to operate in the industries mentioned above. Thus, the indicator also covers enterprises where only part of the activity takes place in the industries concerned. Only establishments with a turnover and number of employees of over 0 are included. Data from Åland have not been included in the indicator due to data protection.
The indicator data have been compiled from data of Statistics Finland's structural business and financial statement statistics.
Prevention of waste generation is central to the circular economy, where the aim is to keep the value of materials and products in circulation for as long as possible. The indicators related to waste are recovery of municipal waste, total amount of waste and waste intensity, as well as production and utilisation of biogas.
If the amount of waste decreases or the growth of its volume slows down, it may mean that prevention of waste generation has become more efficient. Monitoring the amount of waste shows what amount of waste has been collected and transported for waste treatment. Examined by treatment method, it is possible to evaluate the business activity of waste treatment plants operating in the circular economy and its change.
Biodegradable waste is used to produce biogas that can be utilised as fuel in energy production and transport. In this way, methane otherwise released into air in the decomposition process can be obtained for recycling. In addition, material recovery of biodegradable waste is, according to the waste hierarchy, a better alternative than incineration.
Recovery of municipal waste
Municipal waste refers to waste generated in housing as well as comparable waste from trade and services and corresponding waste from manufacturing support activities. In addition to the amount of municipal waste, its material and energy recovery have been selected for the indicator.
If the product can no longer be repaired or reused, the next best option from the circular economy perspective is recycling as material, that is, recycled materials are made of the product's materials and at the same time the need for virgin raw materials decreases. If recycling is not possible, energy recovery is a better alternative than landfilling. It should be seen as a substitute for landfill sites, not material recovery..
Amount of municipal waste divided by recovery methods and recycling rate of municipal waste and EU average in 2010 to 2018
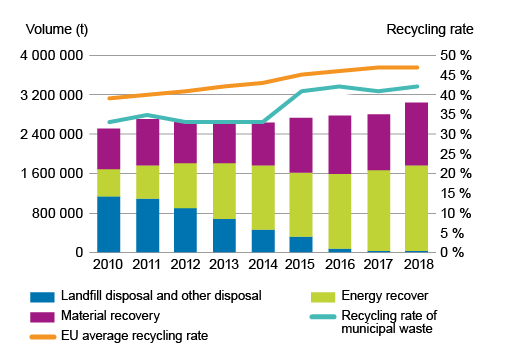
The amount of municipal waste has grown during the reference period..
Material recovery of municipal waste has grown somewhat during the reference period, but energy recovery has increased significantly, to around 57 per cent of all municipal waste. This is partly due to the landfill prohibition of organic waste that came into force in 2016, which has channelled waste to energy recovery.
The indicator on the recycling rate of municipal waste describes the share of material recovery of total waste. The recycling rate has also grown during the reference period. Finland's recycling rate is slightly below the EU average.
All yhdyskuntajäteindikaattorit can be found directly from Statistics Finland's data. They have been compiled as a time series for 2010 to 2018. The data are published yearly. Municipal waste is also part of Eurostat's indicators on the circular economy.
Total amount of waste and waste intensity
The indicator of waste intensity describes the ratio of waste to GDP.
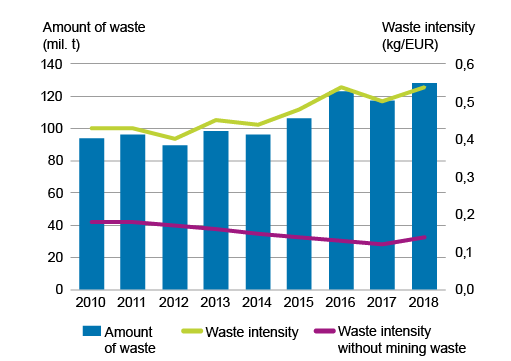
The majority of Finland's waste, around 90 per cent (2018), is mineral waste generated from mining and quarrying and construction, most of which is stockpiled at landfills. Statistics Finland compiles statistics on the generation of waste by industry and on the methods of waste treatment. The total amount of waste has grown during the reference period 2010 to 2018..
The indicator of waste intensity describes the ratio of waste to GDP. The smaller the waste intensity, the more products and services have been produced with less pressure caused by waste on the environment. An examination of the time series, in turn, indicates whether society has been able to generate more wealth and reduce the amount of waste at the same time. The indicator has been compiled as a similar time series as material intensity for 2010 to 2018. The indicator data derive directly from Statistics Finland's statistics.
In addition to the total amount of waste, Finland's waste intensity has grown. However, when the figures are examined without mining waste, the trend is falling. Nevertheless, mining waste is part of Finland's total amount of waste and it is included in the indicator, because it is also part of economy-wide material flow accounts. Much waste is generated and waste intensity also indicates that products and services cause increasing pressures on the environment yearly.
Production and utilisation of biogas
The production and utilisation rate of biogas describe how much biogas has been produced and how much of it has been utilised, that is, what kind of demand biogas has.
Production and utilisation of biogas and flaring of non-utilised share of biogas in 2010 to 2018
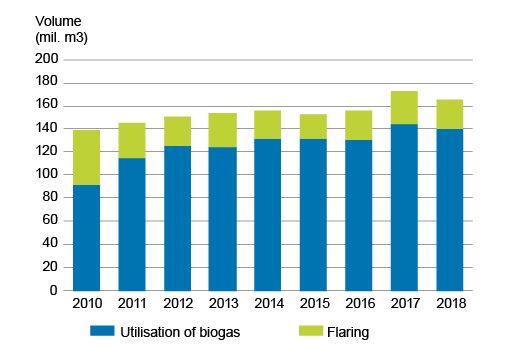
Biogas is produced from waste, such as biowaste, sludge from waste water treatment, manure, industrial by-products and vegetable biowaste. When utilising materials that are otherwise consumed as waste, the production of biogas is an essential part of the circular economy. It is comparable to natural gas, so biogas can replace fossil fuels. In addition, nutrient-rich sludge is generated as its by-product, which can be used as a fertiliser in place of conventional fertilisers. Biogas is mainly used for the production of electricity and heat.
From 2010 to 2017, biogas production grew from 140 million cubic metres to over 170 million cubic metres but fell slightly in 2018. Increased production means that side streams are utilised more if the volume of side streams remains unchanged.
The utilisation rate of biogas describes how much of produced biogas been utilised, that is, what kind of demand biogas has. The utilisation rate of biogas has remained at around 85 per cent in recent years. As a backup solution, excess biogas has to be flared, whereby it is wasted.
Statistics Finland has collected biogas data starting from 2017. The data up to 2017 are from the Finnish biogas plant register (University of Eastern Finland). Methodologically, the calculations differ slightly from one another.
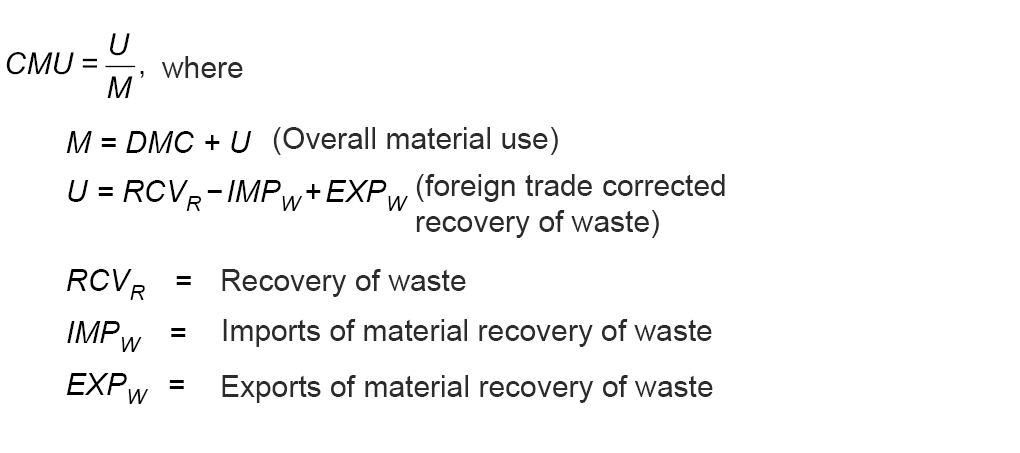
The circular economy aims to reduce the use of virgin raw materials by replacing them with recycled materials. When materials circulate in the economy for as long as possible, resources are saved and less emissions are produced. This cycle is described in the circulation of materials indicator. The circular material use rate (CMU) indicator measures the ratio of the circular use of materials to the overall material use.
In the circular economy, the aim is to keep the life cycle of a product as long as possible. If the product can no longer be reused, remanufacturing is the next best option in accordance with the circular economy model. In remanufacturing, the product is updated or produced again into at least as good as a corresponding new product.
The remanufacturing indicators describe extending the product's life cycle. Compared to a new product, remanufacturing saves natural resources and energy as the product's life cycle is extended.
Reuse and recycling are closely related to waste indicators. When the product is no longer used, it can be recycled as such, it can be repaired to correspond to a new one or it can be recycled as material or waste. The indicator describing material recovery is presented in connection with municipal waste.
Circular material use rate
The circular material use rate (CMU) measures the ratio of the circular use of materials to the overall material use. The calculation takes into account the effects of imports and exports of material recovery of waste.
Circular material use rate by material and in total in 2013 to 2018, and EU average for 2013 to 2018
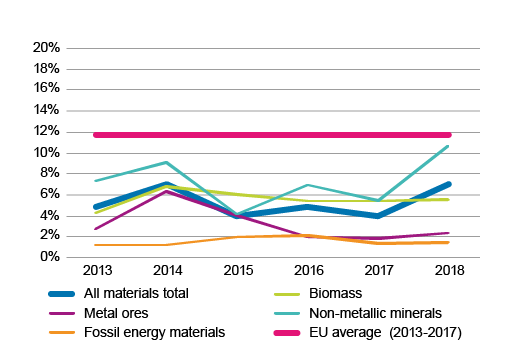
The circular material use rate (CMU) measures the ratio of the circular use of materials to the overall material use. The calculation takes into account the effects of imports and exports of material recovery of waste.
The higher the circular material use rate, the more recycled materials have been able to replace the need for virgin raw materials and the smaller the burden on the environment. Reducing the use of virgin raw materials is a key element of the circular economy.
The indicator was compiled as a time series for 2013 to 2018 and additionally divided into materials according to domestic materials consumption: biomass, metal ores, non-metallic minerals and fossil energy materials (see materiaaliluokitus). The circular material use rate in Finland was around seven per cent in 2018; the figure grew slightly from the previous years. Examined by material, the circular material use rate is highest for non-metallic minerals.
The Finnish circular material use rate is lower than the EU average. However, the economic structure of different countries has a significant effect on comparability - Finland has a high DMC compared to other EU countries due to the large volume of mining and quarrying.
The model is developed by Eurostatand the figure is not produced regularly at Statistics Finland. However, the figures needed in the calculation can be obtained from Statistics Finland's databases. The circular material use rate is one of Eurostat's indicators of the circular economy.
Circulation of materials
The circulation of materials in the economy can be described with the help of use of domestic natural resources, waste treatment and emissions.
For the time being, only a very small proportion of all used materials comes from material recovery.
The material flow chart below illustrates virgin materials extracted during the calendar year, their use and their ending up in different waste treatment processes. The chart takes into account the imports and exports of materials and the return of recycled waste to circulation. Material reserves, emissions and other flows are imputed and are based on the amount of material that does not end up in waste treatment during the calendar year, that is, which is stored as material for consumption or ends up in air as an emission, for example. The figures are expressed in million tonnes. Most of Finland's material flows are non-metallic minerals.
Circulation of materials described in the Sankey diagram for the statistical reference year 2018
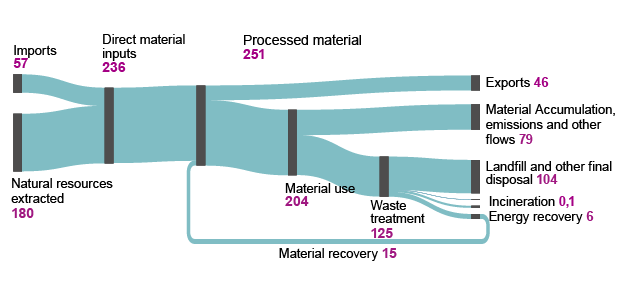
The data on material use are based on the annually published statistics on economy-wide material flow accountsand waste treatment data on waste.
Remanufacturing and reuse
Remanufacturing is illustrated by the value of retreading of heavy vehicle tyres, and reuse is described by the amount of electrical and electronic waste reused as a whole.
Value of retreaded tyres in 2013 to 2018
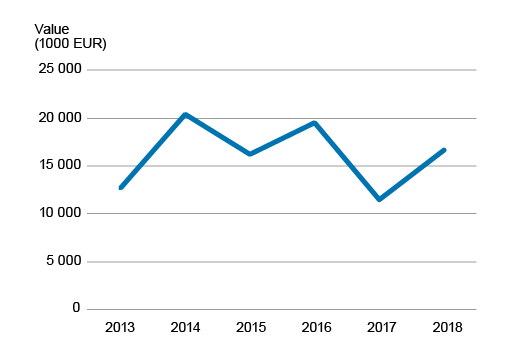
One typical remanufactured product is a car tyre. Especially heavy vehicle tyres are retreaded in Finland. The retreading value of tyres used on buses and trucks has varied between EUR 10 and 20 million in 2013 to 2018. In Finland, particularly heavy vehicle tyres are retreaded, which reduces tyre waste and saves natural resources, such as oil and rubber. The indicator data derive from Statistics Finland's statistics on industrial output, which use the PRODCOM classification used in the EU for the classification of industrial products.
Volume of electrical and electronic waste reused as a whole in 2010 to 2018
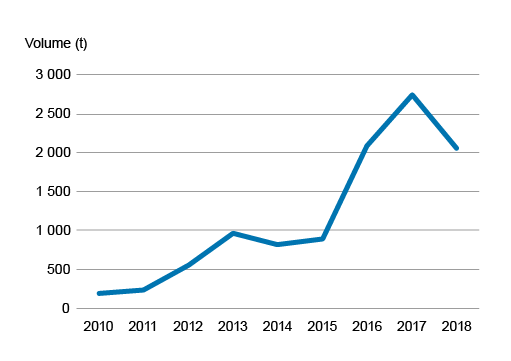
The volume of electrical and electronic equipment reused as a whole increased from around 200 tonnes to over 2,700 tonnes in 2010 to 2017 but fell close on 2,000 tonnes in 2018. Reuse reduces electrical and electronic waste and saves natural resources. The indicator data derive from the producer responsibility data compiled by the Centre for Economic Development, Transport and the Environment for Pirkanmaa..
Reuse refers to reuse of the decommissioned material or its parts. These data are not currently available from Statistics Finland's statistics. Data on electrical and electronic equipment reused as a whole can be obtained from the producer responsibility statistics compiled by the Centre for Economic Development, Transport and the Environment for Pirkanmaa.
Lataa tiedot
Download indicator data (xlsx) Download regional indicator data (xlsx)