
From slash-and-burn fields to post-industrial society - 90 years of change in industrial structure
When Finland gained its independence it had a population of 3.1 million people. Now, 90 years on, the Finnish population numbers 5.3 million. The population structure is, however, radically different as decreasing births lower the number of children and longer life expectancy adds to the number of elderly people. Radical changes are also visible in the industrial structure. In the early 20th century Finland was an entirely agricultural society, whereas now we live in a post-industrial society based on services.
Agriculture was the source of livelihood for 70 per cent of the Finnish population in 1920 and only 10 per cent of the population got their livelihood from industry. The majority of all industry consisted of forestry and food processing, i.e. sawmills, paper industry, dairies, mills and meat processing. A small part of the workers got their livelihood from services, trade, transport and construction. As jobs this translates into shopkeepers, teachers, maids, police officers, railway workers, seamen and builders of houses and the road network.
In the early days of Finnish independence many were engaged in so called unskilled mixed work, or their occupation remained unknown. Some of the unskilled workers found their livelihood in occupations associated with agriculture. They were wanderers who took on any work they could find in construction, forestry or log driving.
In rural areas many industries merged into agriculture
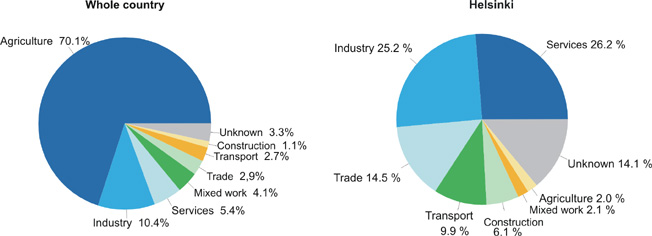
Regional differences in the industrial structure were considerable. For instance in Pielavesi, the home municipality of the long-serving Finnish President Urho Kaleva Kekkonen, agriculture was the source of livelihood for 97 per cent of the population, while the corresponding percentage in the capital city Helsinki was only 2 per cent. Helsinki was largely industrialised and more service-oriented: already one-half of the workers were engaged in these fields, 15 per cent in trade and 10 per cent in transport (figure 1).
Figure 1. Industrial structure in 1920
In rural areas many industries merged into agriculture. There was little separate construction, for example, as dwellings and cowsheds were either self built or built with the help of voluntary work. In the field of transport the horse-drawn transports of goods such as timber, milk and grain were an integral part of agriculture. "Food industry" such as the milling of grain, the churning of butter, the slaughtering of animals and the processing of meat by salting of smoking was, at least in part, merged into agriculture.
Banks, insurance companies and business services were still absent from the rural industrial structure. The service sector comprised farm-owners' maids and nursemaids. For a fee the small scale social services, or poor relief, found placements for e.g. orphans and lonely elderly people as unskilled workers in houses. Illnesses and births were taken care of at home. General compulsory education had already brought school buildings and teachers into villages.
The development of public services created an abundance of new jobs
The industrial structure changed rather slowly from the early 20th century until the Second World War. The share of agriculture in fact grew somewhat in the early years of Finnish independence in connection with the land reform. Industrialisation, which was underway since the 1920s, progressed at a steady pace until the war years.
Trade and transport grew strongly in the period after the Second World War. The share of trade grew fivefold and that of industry threefold in 50 years. Growth in services, for example, was very rapid after the war when public services were being developed. Widely accessible health care and social services were set up during that period. At the same time age groups were being educated more comprehensively: as late as in 1950 seventy-one percent of the 15 to 24-year olds were working, but in 2004 the corresponding percentage was only 35. The majority of young people are now enrolled in various education institutions, and a large part of the 35 per cent who work are also studying.
As public services expanded more labour force was needed to the public sector especially in the fields of education, health and social services. After 1950 the number of municipal sector employees has quadrupled (table 1). These jobs were created both in rural areas and in towns. New job creation in the private sector mostly took place in Southern Finland and in major cities which recruited the best educated parts of the large age groups.
Table 1. Wage and salary earners by employer's sector 1950-2004 (1,000 persons)
| Year | Employer | ||||
| State | Municipality, Joint municipal board |
Company owned in majority by the state |
Private | Total | |
| 1950 | 146 | 97 | 44 | 840 | 1,153 |
| 1960 | 177 | 137 | 57 | 928 | 1,336 |
| 1970 | 187 | 94 | 67 | 1,156 | 1,654 |
| 1980 | 226 | 337 | 96 | 1,180 | 1,858 |
| 1990 | 216 | 466 | 110 | 1,211 | 2,003 |
| 1995 | 146 | 446 | 142 | 927 | 1,664 |
| 2000 | 144 | 486 | 93 | 1,260 | 1,984 |
| 2004 | 148 | 496 | 75 | 1,306 | 2,026 |
The number of pensioners has quadrupled since the 1950s
In 1920 just short of one-half of the population were classified as employed persons (table 2). There were many minor children and virtually no students or pensioners. In rural areas people participated in working life as long as they could. At its highest the share of employed persons of the entire population has been close to, and even over, 50 per cent. At present the share of employed persons is 43 per cent, which is roughly unchanged from the figures of the early years of Finnish independence. The present share of employed persons of the whole population is diminished by high unemployment, the growing numbers of pensioners and radically more common studying; over 90 per cent of the age groups obtain some post-comprehensive school qualification.
The number of pensioners has more than quadrupled since 1950. Their number is now 1.2 million. The development varies considerably by region. In rural areas both the working age and employed population continues to shrink and the number of elderly people grows. There are already numerous municipalities where a larger part of the population is retired than in gainful employment.
The relationship between the employed population and the persons not working is known as the dependency ratio. The ratio, which describes how many non-working persons there are per one hundred employed persons, shows great regional variation. In rural municipalities with migration loss the ratio can be over 200, while in the best performing municipalities around Helsinki it is lower than 100.
Table 2. Population by primary activity 1900-2004 (1,000 persons)
| Year | Population | Employed persons | Share of labour force % | Unemployed | Aged 0 to 14 |
Students, others | Pensioners | Dependency ratio1) |
| 1900 | 2,712 | 831 | 31 | 949 | 226 | |||
| 1920 | 3,105 | 1,499 | 48 | 1,037 | 107 | |||
| 1940 | 3,696 | 2,017 | 55 | 994 | 83 | |||
| 1960 | 4,446 | 1,997 | 45 | 31 | 1,340 | 762 | 318 | 123 |
| 1980 | 4,785 | 2,108 | 44 | 114 | 965 | 777 | 819 | 127 |
| 19902) | 4,998 | 2,332 | 47 | 141 | 964 | 520 | 1,040 | 114 |
| 2000 | 5,181 | 2,229 | 43 | 318 | 936 | 579 | 1,119 | 132 |
| 2004 | 5,237 | 2,262 | 43 | 299 | 914 | 594 | 1,166 | 131 |
1) Dependency ratio = (persons not
working/employed persons) x 100
2) The unemployed are seen to include
also persons registered as unemployed job seekers (1990-)
The industrial and employment situation was shaken up by the economic upheavals of the late 20th century
The Finnish economy grew in the post-war period all the way to the late 1980s. After that the 4 to 5 year long period of recession swept away half a million jobs. Relatively the largest losses were suffered by construction, industry and trade. Business support activities made it with smaller losses and rapid economic growth has already increased the number of jobs to a level which is clearly above the pre-recession numbers. Public services, or education, health care and social services, have also recovered beyond pre-recession levels. In agriculture, however, job loss still continues.
The current most important creators of employment are the electronic industry and forestry, business services, social and health services as well as trade. These branches are also growing the fastest. Jobs are still decreasing in food and textile industries.
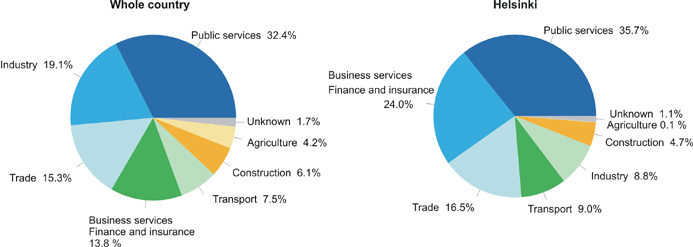
Figure 2. Industrial structure 2004, share of employed population
The majority of Finnish jobs are in urban municipalities
In 2004 there were slightly less than 2.3 million jobs in Finland. Seventy-two per cent of the jobs and 63 per cent of the population were located in urban municipalities (table 3). In these municipalities the share of the service industries of all jobs is typically large, between 42 and 85 per cent. Further processing has a share of 15 to 55 per cent and agriculture, even at its highest, only 13 per cent.
Semi-urban municipalities, that is, municipalities surrounding large towns, have 14 per cent of all the jobs in Finland and 17 per cent of the population. Such municipalities have slightly more primary production and clearly more processing than urban municipalities. Correspondingly, the share of services is smaller.
Rural municipalities have only 15 per cent of Finnish jobs and 20 per cent of the population. These municipalities have a double-peaked industrial structure: agriculture is still the source of, on average, a good 20 per cent of jobs, and public services have a share of roughly 25 per cent. In some rural municipalities over 50 per cent of all jobs are still in agriculture. The share of services can also be very high, even over 70 per cent. The majority of these jobs are in public services, that is, work generated by the municipality itself. The third largest creator of employment in rural municipalities is industry with its 77,000 jobs. Rural municipalities have nearly the same proportion of jobs in construction and transport as urban or semi-urban municipalities.
Table 3. Number of jobs and population by type of municipality, 2004
| Jobs | Population | |||
| Number | % | Number | % | |
| Urban municipalities | 1,620,425 | 71.6 | 3,275,616 | 62.6 |
| Semi-urban municipalities | 305,159 | 13.5 | 893,001 | 17.1 |
| Rural municipalities | 336,775 | 14.9 | 1,067,994 | 20.4 |
| Whole country | 2,262,359 | 100 | 5,236,611 | 100 |
Helsinki and Pielavesi in the 21st century
What has happened in our sample municipalities Helsinki and Pielavesi during Finnish independence? Helsinki has become more service-oriented. In present day Helsinki the share of public services is 36 per cent and that of business services is 24 per cent of all jobs (figure 2), whereas in the early years of the 20th century all services were the source of livelihood for approximately 26 per cent of the population.
Our other sample municipality clearly demonstrates the general social and demographic development with the associated changes in age and industrial structures. Pielavesi was a typical agricultural municipality of the early 20th century. Currently 33 per cent of Pielavesi's population is working, 36 per cent are retired and the dependency ratio stands at 210. Of the employed, one-fourth are engaged in agriculture, 29 per cent in public services and slightly less in private services.
From church records via inquiries to register-based production of statistics
From the early 20th century until 1940 the classification of occupations was based on information entered into church records. It is clear that changing information was not updated comprehensively. If a person had been entered as a maid, a crofter or a general worker, the information was not necessarily changed even if the person's duties changed.
Generally information on occupation was only given for the head of the family and other members of the same family were automatically assumed to engage in the same occupation. In the family of a crofter, for instance, all persons were occupied in agriculture.
Some of the parishioners were defined as unskilled or mixed workers and for some the source of livelihood remained unknown. These kinds of employment relationships were, also in light of their duration, the atypical and temporary jobs of the time. Apparently Helsinki had a higher than average share of changing population, for whom accurate data on the source of livelihood was not available, and therefore the share of persons without a known occupation was as high as 14 per cent (figure 1).
In the period between 1950 and1985 industrial structure was defined on the basis of direct population censuses. As from 1987 population census data has been produced annually and data in industry is based on the industry of the person's employer. The employed labour force is seen to include all persons aged 15 to 74 who are in gainful employment in the last week of the year and are not registered as unemployed job seekers at the labour exchange offices or performing mandatory military or non-military service. Data on employment is based on the information of the employees' pension authorities and the tax administration. The unemployed labour force is seen to include all persons aged 15 to 64 who are unemployed on the last working day of the year. Data on unemployment is based on the Ministry of Labour's register of unemployed job seekers. This reform has both improved the reliability of data and significantly lowered the costs of producing the statistics.
Inquiries: Mr Pekka Myrskyl� +358 9 1734 3555
Sources and additional information
Information on statistical methodology and concepts can be found on the home pages of the statistics.
- Employment
statistics
Employment statistics are annual statistics providing data by region on the population's economic activity and employment. The population for the statistics is the permanently resident population in the country on the last day of the year. The data are mainly derived from administrative registers and statistical data files. - Population
censuses
Data from population censuses are used in the describing and planning of the structure of society and its changes. Population censuses are drawn in almost all countries of the world. To ensure the comparability of census data the UN and the EU issue recommendations on their contents and data definitions as well as on the classifications to be used in them. - Other
population statistics
Cover statistics on the size and structure of the permanently resident population and related changes. - Population
statistics service on the Internet (Chargeable service
available in Finnish and Swedish only. The introductory information
is accessible to all)
The statistics service is an easy to use, quick and comprehensive source of population statistics. The data have been compiled into the service as thematic databases (population structure, population projection, population change, migration, industrial structure, employment and commuting, household-dwelling units, families, housing conditions, dwellings and free-time residential buildings). Tables can be generated for example with different regional divisions.
Last updated 20.2.2007