|
|
|
|
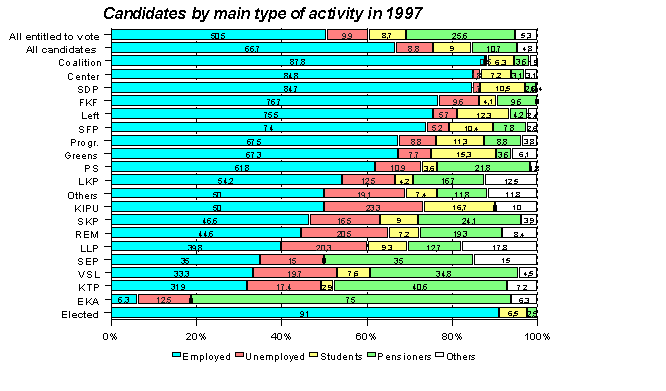
Updated 22 March 1999 Parliamentary elections 1999 - Backgrounds of the candidatesPekka Myrskylä Compared to persons entitled to vote, the candidates form a select group: they are highly educated, well paid employed persons with more assets than average. More often than the rest of the population, the candidates are married fathers or mothers and live in detached or terraced houses of their own. Labour force participationThere are clear differences between the candidates by party. Of all persons entitled to vote, one half are employed, ten per cent unemployed or students, and one fourth pensioners. Almost all (85 to 88 per cent) of the candidates of the three major parties, the National Coalition Party, the Center Party and the Social Democratic Party, are employed, hardly any of them are unemployed and only about ten per cent are students or pensioners. The Christian League of Finland, the Left Wing Alliance, the Swedish People's Party, the Progressive Finnish Party and the Green League have fewer employed persons, but more students and pensioners, among their candidates than the major parties. In the smallest parties, the number of those not employed is even higher than the average for the population. The candidate structure of the Ecological Party corresponds most closely with the average population. The Ecological Party, the Reform Group and the Natural Law Party have the highest number of unemployed candidates and the pensioners' parties have relatively the most pensioner candidates. The Ecological Party, the Greens and the Left Wing Alliance have more student candidates than average.
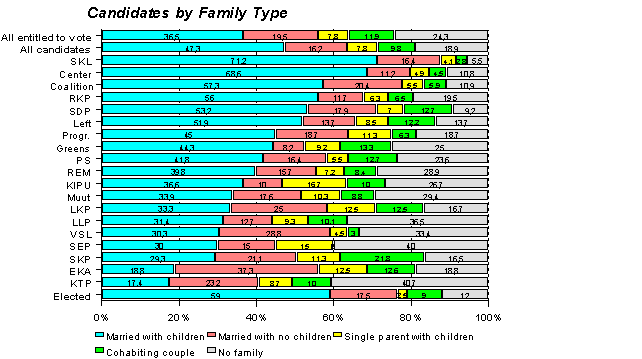
Family type and number of childrenMore than one half (56%) of all persons entitled to vote are members of married families, 12 per cent are cohabiting and one fourth do not belong to a family. Two thirds of the candidates are married, 10 per cent are cohabiting and 19 per cent do not belong to a family. In both groups, eight per cent are single parents. The candidates of the Christian League differ most from the average population: 88 per cent are married and only three per cent are cohabiting. The majority of the major party candidates are also from married families: 80 per cent of the Center Party candidates, 78 per cent of the National Coalition Party candidates and 71 per cent of the Social Democratic Party candidates; at 13 per cent, the Social Democrats also have the highest number of cohabiting candidates. More than one half of the major party candidates also have children in addition to a spouse, which means that the life of a family with children is more familiar to them than to voters on average; it is the most familiar to the Christian League and the Center Party candidates.
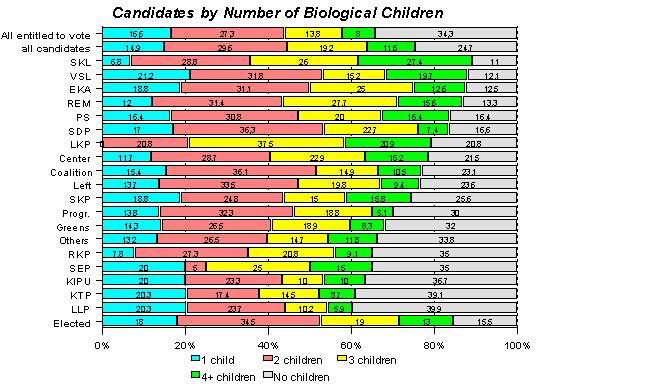
Since the majority of the candidates live in married families with children, obviously only a few of the candidates have no children. Thirty-four per cent of those entitled to vote have not had or do not yet have children of their own, the corresponding figure for the candidates being 25 per cent.
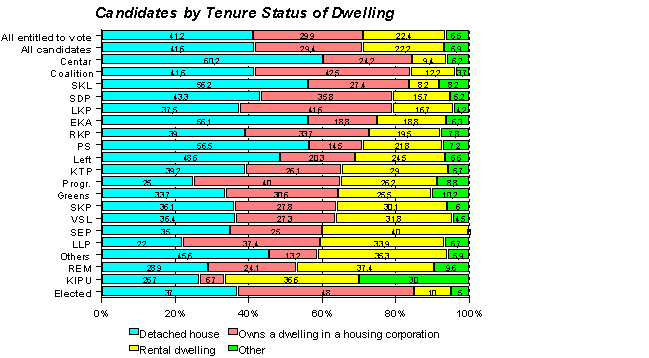
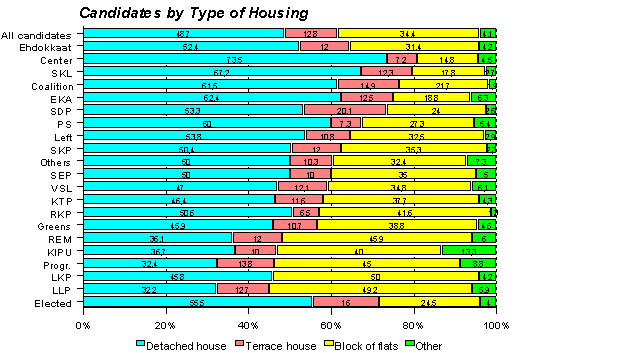
Only 11 per cent of the Christian League candidates, 17 per cent of the Social Democrats, 22 per cent of the Center Party and 23 per cent of the Coalition Party candidates have no children of their own. The candidates have child care fresher in their minds than the average population. The proportion of people without children was higher in the parties with more young student candidates. Living conditions of candidatesFinns generally live in owner-occupied dwellings: only 22 per cent of those entitled to vote are renting, and the same applies to candidates. The major party candidates with a family live in owner-occupied dwellings. Eight in ten of the Center Party, the Coalition Party and the Social Democratic Party candidates live in owner-occupied dwellings, usually in detached houses. 40 per cent of the Social Democratic and the Coalition Party candidates live in dwellings in a housing corporation.
The candidates of the Center Party, the Coalition Party, the Christian League, the Social Democratic Party and the Left Wing Alliance live in detached houses. Only 15 to 25 per cent of the candidates of these parties live in blocks of flats, while this is the case for 34 per cent of all voters.
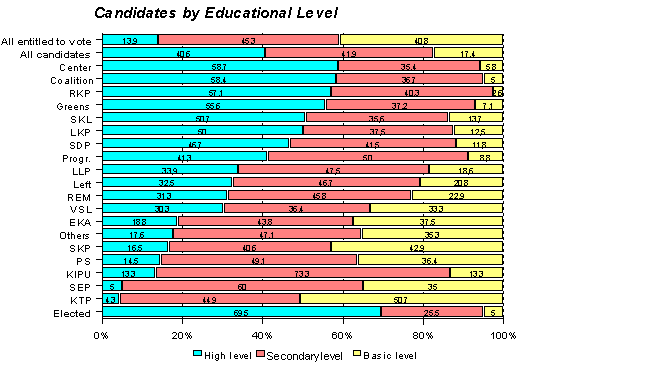
Educational levelHighly educated people are elected to the Parliament. The educational level of the candidates of almost all parties is higher than that of the average population. Of the total population, 41 per cent rely on basic level education, but this is the case for only 17 per cent of the candidates and for even fewer of the major party candidates, that is, 6 per cent for the Center Party, 5 per cent for the Coalition Party, 3 per cent for the Swedish People's Party, 7 per cent for the Greens and 12 per cent for the Social Democratic Party. Almost 60 per cent of the major party candidates are educated to the tertiary level, but only 14 per cent of those entitled to vote have attained that level. The level of education among the older population is lower than average and consequently, the educational level of the candidates of the pensioners' parties is also lower.
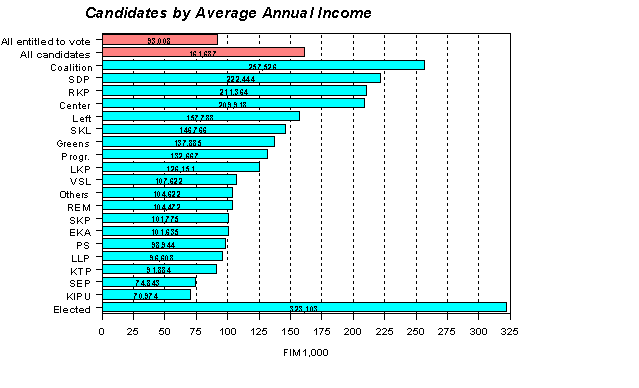
Income and assetsAs to income and assets, the candidates differ considerably from the rest of the population. In 1997, the taxable income of the candidates was 74 per cent higher than that of persons entitled to vote, whose average taxable income was FIM 93,000. The income of the major party candidates is more than two-fold compared to that of voters; in the case of the Coalition Party candidates, it was 2.8-fold, or FIM 260,000, the Social Democratic Party, 2.4-fold, i.e. FIM 230,000, the Swedish People's Party and the Center Party, 2.3-fold, i.e. their taxable income was FIM 220,000. Only some minor party candidates had a lower income than average.
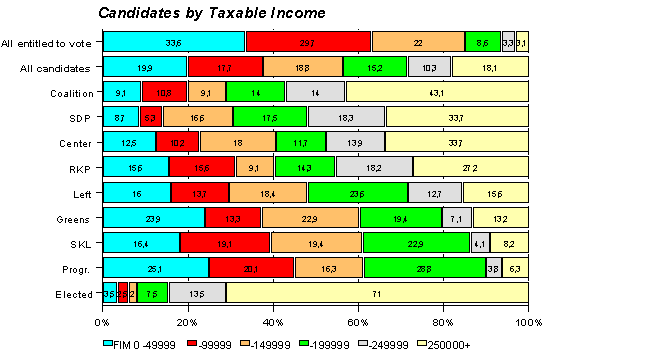
The majority of the major party candidates have an income of over FIM 200,000; in other words, 57 per cent of the candidates of the Coalition Party, 52 per cent of those of the Social Democratic Party, 48 per cent of the Center Party and 45 per cent of the Swedish People's Party candidates had an income of over FIM 200,000. Of all persons entitled to vote, the income of only 6 per cent exceeds FIM 200,000. The Center Party and the Swedish People's Party differ from the Coalition Party and the Social Democratic Party in that some of their candidates earn less than FIM 50,000. The same is true for the Greens and the Progressive Finnish Party who have more students, for example, on their lists of candidates. One in three voters has to get by on an income of less than FIM 50,000, but this is the case for every tenth Coalition Party candidate.
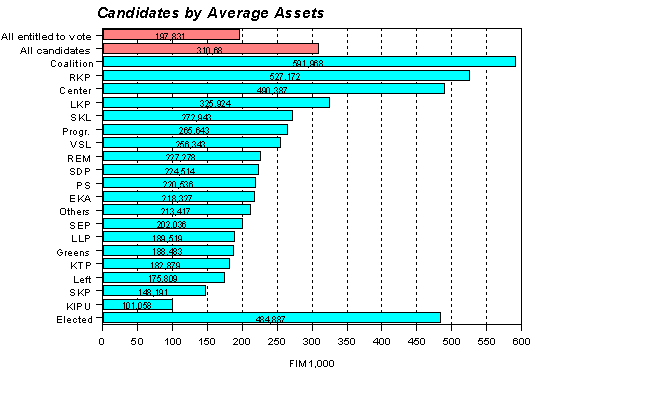
According to the tax records, the assets of persons entitled to vote amount, on average, to FIM 200,000, and those of the candidates to FIM 310,000. The Coalition Party candidates had the highest assets, of FIM 592,000, the Swedish People's Party candidates had FIM 527,000 and the Center Party candidates FIM 490,000. Of the major parties, the Social Democrats have clearly the lowest assets, at FIM 225,000.
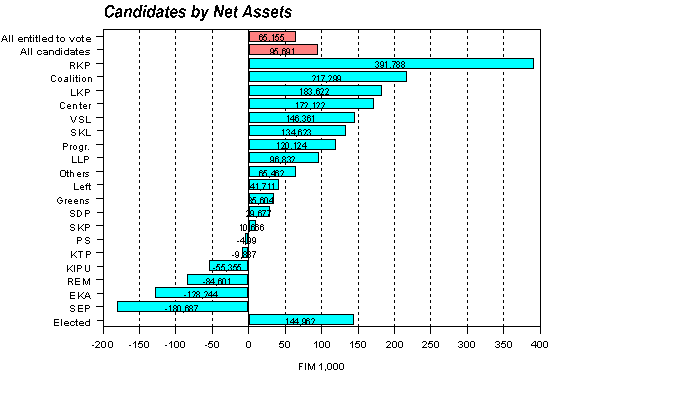
Deducting the candidates' debts from their taxable assets gives us a picture of their net assets. Persons entitled to vote have net assets worth FIM 65,000, and the candidates FIM 96,000, on average. There are great differences between the parties: the average assets of the Swedish People's Party candidates amount to FIM 392,000, those of the Coalition Party candidates to FIM 217,000, those of the Center Party candidates to FIM 172,000 and the Social Democratic candidates to FIM 30,000. The debts of the minor party candidates exceed their assets, which puts their net assets in the negative.
Statistics Finland Election statistics Email: vaalit.tilastot@tilastokeskus.fi |


