|
|
|
Coalition and Greens the election winners
The Coalition and Centre Parties retained their four seats in the European Parliament, while the Social Democratic Party retained three of its four seats. The Greens gained one extra seat and now have two MEPs. The Left Wing Alliance lost one seat and now only has one representative in the European Parliament. The Swedish People's Party in Finland retained its position with one representative, while the Christian League of Finland, with its one representative, became a newcomer to the European Parliament Finnish MEPs are allocated in the European Parliament into the following groups
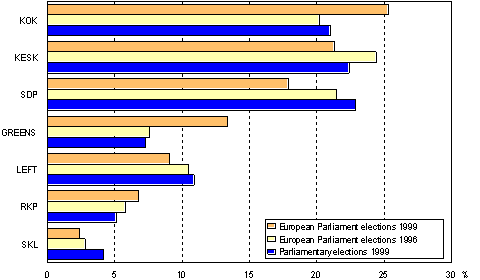
The Coalition Party was the election winner. It received 313,960 votes, or good quarter (25.3%) of all votes cast. Compared to the previous European Parliament election, its support increased by 5.1 percentage points. Also compared to the 1999 national Parliamentary election, its support increased by a considerable 4.2 percentage points. The Greens received 166,786 votes. Although they received the fourth largest number of votes of all the parties, they increased they support by most, 5.8 percentage points. They were also the only one of the current parties in the European Parliament election to gain an extra seat. The second largest number of votes of 264,640 was received by the Centre Party of Finland. Its support fell by 3.1 percentage points from the previous corresponding election. Compared to the national Parliamentary election, it lost less support this time, only 1.1 percentage points. The Social Democratic Party received 221,836 votes, 17.9 per cent of all votes cast, and suffered a loss of 3.6 percentage points compared to the previous corresponding election, and as high as loss as 5.0 percentage points compared to the national Parliamentary election. The number of votes cast for the Left Wing Alliance was 112,757, or 9.1 per cent of all votes cast. Its support fell by 1.4 percentage points from the previous European Parliament election. The Swedish People's Party in Finland received 84,153 votes, which is 6.8 per cent of all votes cast. The votes cast for the Christian League numbered 29,637, or 2.4 per cent of all votes cast. Other parties failed to get their representatives to the European Parliament. Proportion of votes cast for the major parties in elections for the European Parliament in 1999 and 1996 and in the parliamentary elections in 1999
Proportion of votes cast for the major parties in elections for the European Parliament in 1999 and 1996 and in the parliamentary elections in 1999
Record low turnout of 31.4 per centThe total number of those entitled to vote in this election was 4,165,689. Their distribution by country of residence, nationality and gender was as follows:
As forecast, voting turnout remained low. The turnout percentage was exceptionally low, and much lower than ever before in Finland. The turnout percentage was only 31.4, which is 28.8 percentage points lower than in the previous European Parliament election in 1996. Examined against the March national Parliamentary election, the turnout percentage as even lower, being 37 percentage points lower. Turnout was higher than elsewhere in the country in Helsinki constituency, where voting turnout got as high as 40.5 per cent. Turnout percentages in all other constituencies remained clearly below 40. Second highest turnout percentages were achieved in Vaasa constituency (34.2%) and Uusimaa constituency (34.2%). Turnout was the lowest in Åland (21.8%) and Kuopio (25.7%) constituencies. Päivitetty 2.3.2004 Contact InformationElection statistics E-mail: vaalit.tilastokeskus@tilastokeskus.fi |
||||||||||||||||||||||||||||||||||||||||||||||||||||||||||||


