|
|
|
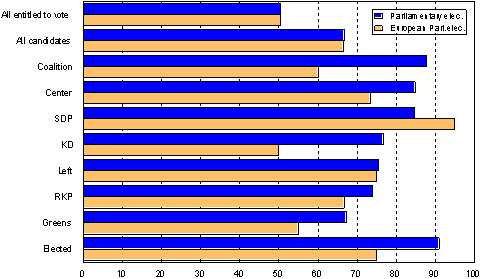
Backgrounds of the candidatesThis round of the European Parliament elections failed to interest the political parties as much as the previous one. A total of 140 candidates were nominated by 11 parties for the election. In the previous election, 14 parties nominated 207 candidates. Gender distribution among the candidates was 55 (39%) women and 85 (61%) men. In the previous election, in 1996, the distribution was 79 male and 129 female candidates, in other words 38 and 62 per cent, respectively. With the Greens, the proportion of female candidates was 60 per cent, and with the Coalition Party, 50 per cent. With the other parties, the proportion of female candidates fell below this. The average age of a candidate was 46.8 years. With female candidates, the average age was 44.6 years and with male candidates 48.2 years. The average age fell by a couple of years since the last election. Sixty-six per cent, or about the same proportion as in the national parliamentary election but a considerably higher proportion of those entitled to vote (50%) were employed. At least where the major parties are concerned, the candidates in the European Parliament election differed from those in the Finnish Parliamentary election by including more pensioners and students. Only 8 of all the candidates were unemployed, while 15 were pensioners and 17 students. Almost all, or 91 per cent, of the candidates elected to the national Parliament were employed, while 75 per cent of the elected MEP candidates were employed. Proportion employed in 1997 of candidates in Parliamentary elections and European Parliament elections in 1999
Proportion employed in 1997 of candidates in Parliamentary elections and European Parliament elections in 1999
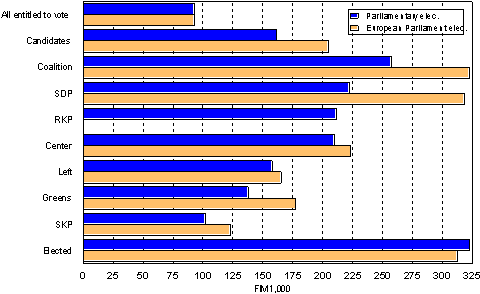
The candidates were very well to do. The average income subject to state taxation of those entitled to vote was FIM 93,000 per annum in 1997, while the equivalent of the candidates in the national Parliamentary election was FIM 162,000, and that of the MEP candidates FIM 205,000. The average income of the Coalition and SDP candidates exceeded FIM 300,000. With the other parties, the candidates' average income subject to state taxation fell generally below FIM 200,000. The analysis only relates to income taxable in Finland. On average, only persons with higher than average income - i.e. exceeding FIM 323,000 per annum and over three times that of those entitled to vote - were elected to the Finnish Parliament. Those elected to the European Parliament had an average annual income subject to state taxation of FIM 313 000 per annum. Candidates by average income (FIM) in 1997 in Parliamentary elections and European Parliament elections in 1999
Candidates by average income (FIM) in 1997 in Parliamentary elections and European Parliament elections in 1999
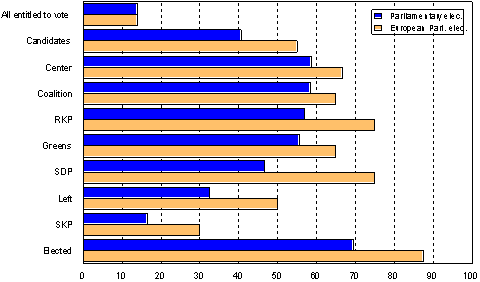
The educational level of those aspiring to become MEPs was high. While 14 per cent of all those entitled to vote held a tertiary level degree, this was true of 55 per cent of the MEP candidates and 41 per cent of the candidates in the national Parliamentary election. Well over one half of the candidates of the main parties in the national Parliamentary election and a clearly higher proportion of the candidates in the European Parliament election had a tertiary degree. With the Coalition Party, Centre Party and Greens, the proportion was 65 per cent and with RKP and SDP as high as 75 per cent. The influence of high level of education in the selection is obvious. Seventy per cent of those elected to the national Parliament, and 87,5 per cent of the elected MEPs had a tertiary level degree. Proportion of highly educated of all candidates in Parliamentary elections and European Parliament elections in 1999
Proportion of highly educated of all candidates in Parliamentary elections and European Parliament elections in 1999
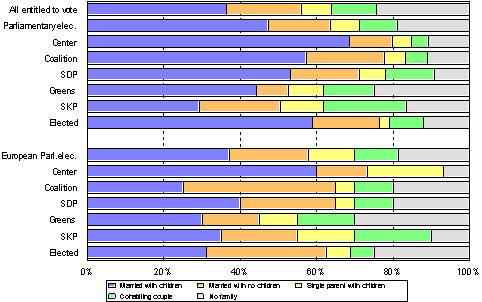
One quarter (24.3%) of those entitled to vote live outside the traditional family, well over one half (56%) are members of married families, while ten or so per cent (11.9%) live in cohabiting families. Two thirds of the MEP candidates live in a married partnership and 37 per cent also have under-aged children living at home. One in five of the candidates live outside a family relationship. The number of candidates living in a cohabiting partnership is the highest with the Centre Party and the National Coalition Party, and the lowest with the Greens and SKL, which have higher than average proportions of married candidates. Candidates with families receive popular support in elections. Of all those elected to the national Parliament, 77 per cent lived in married families, while the corresponding percentage among those elected to the European Parliament was 62,6. Candidates by family type in Parliamentary elections and European Parliament elections in 1999
Candidates by family type in Parliamentary elections and European Parliament elections in 1999
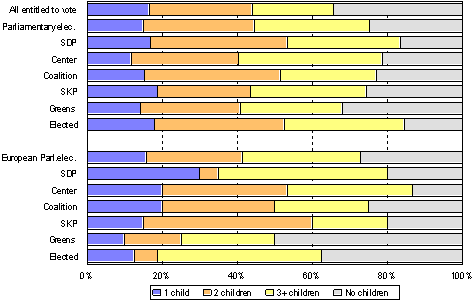
There are more mothers and fathers of children among the candidates than among the rest of the population. Two thirds (66%) of all those entitled to vote have biological children, while this was the case for 75 per cent of the candidates in the national Parliamentary election and for nearly as many of the MEP candidates. Of the major party candidates, 75 to 85 per cent have experiences of own children. The MEP candidates of the Centre Party, of whom 87 per cent have biological children of their own, have the widest experiences of own children. One half of the Green MEP candidates have no biological children of their own. Of the candidates elected to the national Parliament, 85 per cent have children, while this is the case with 62,5 per cent of the elected MEP candidates. Candidates by number of biological children in Parliamentary elections and European Parliament elections in 1999
Candidates by number of biological children in Parliamentary elections and European Parliament elections in 1999
Last modified 2.3.2004 Contact InformationElection statistics E-mail: vaalit.tilastokeskus@tilastokeskus.fi |
||||||||||||||||||||||||||||||||||||||||||||||||||||||||||||||||||||||||||||||||||||||||||||||||||||||||||||||||||||||||||||||||||||||||||||||||||||||||||||||||||||||||||||||||||||||||||||||||||||||||||||||||||||||||||||||||||||||||||||||||||||||||||||||||||||||||||||||||||||||||||||||||


