

Tämä tilasto on lakkautettu.
Tilastotietoa tästä aiheesta julkaistaan toisen tilaston yhteydessä.
Total energy consumption fell clearly
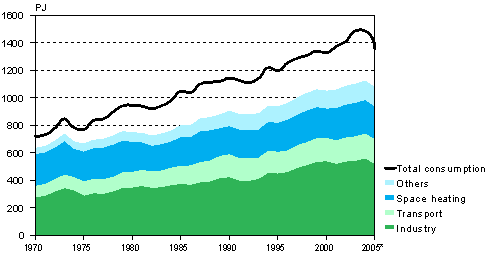
According to Statistics Finland's preliminary data, total consumption of energy in Finland fell by nine per cent in 2005 from the previous year and amounted to 1,360 petajoule (PJ), corresponding to 32.4 Mtoe. Final consumption of energy also decreased by four per cent. Final consumption of energy is derived by deducting transmission and transformation losses from total energy consumption. It thus refers to the amount of energy left for the use of enterprises, households and other consumers. Consumption of electricity also declined by 2.5 per cent and amounted to slightly under 85 terawatt hours (TWh).
The fall in total consumption of energy was mainly due to the fact that production of condensate electricity decreased to one third compared with the year before and net imports rose record high. This was a result of the improved water situation in the Nordic Countries. The decrease in final energy consumption and electricity consumption was due to the reduced energy need of industry, one of the reasons being the industrial action in the forest industry.
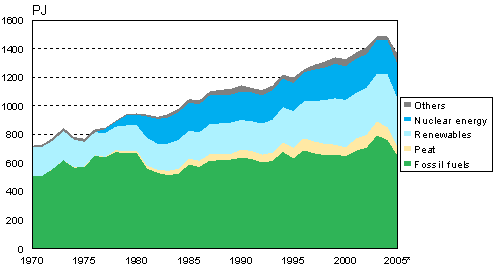
Total Energy Consumption and Final Energy Consumption by Sector 1970-2005
* Preliminary
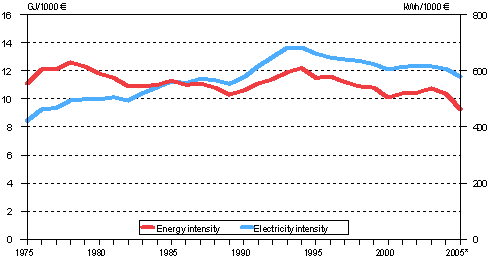
According to Statistics Finland's preliminary data, gross domestic product increased by 2.1 per cent in 2005. Production in the processing industries fell by nearly one per cent and production in the service industries grew by three per cent. Production in the wood and paper industry decreased by nearly ten per cent. Production in the whole manufacturing industry fell by 1.9 per cent. Energy consumption of industry fell following the decreased production of energy-intensive industry. Energy consumption of transport was on level with the previous year. Energy intensity, or the relation of total energy consumption to gross domestic product, continued the fall that started in 2004. Electricity intensity also decreased further. Last year both energy and electricity intensity were at their lowest in the last ten years.
Energy and Electricity Intensity 1975-2005
* Preliminary
Use of fossil fuels and peat decreased considerably
The use of fossil fuels fell by 15 per cent and that of peat by 26 per cent from the year before. Among fossil fuels, consumption of coal decreased most, by around 41 per cent. This large decrease was due to falling use of hard coal. In addition, consumption of coke, blast furnace gas and coke oven gas included in coal declined only a little. The use of natural gas also fell by nine per cent from the previous year. The considerable decrease in the use of fossil fuels and peat was caused by the reduction in production of condensate electricity. Combined heat and power production also declined, because the energy need of industry fell and the need for heating energy declined due to the warmer weather than in the previous year.
The use of oil decreased by three per cent in 2005. Similarly as the other power plant fuels, consumption of heavy fuel oil fell substantially, by nearly ten per cent. Clearly less light fuel oil used for heating was consumed than one year previously. Of transportation fuels the sale of petrol fell slightly, while that of diesel grew by around one per cent.
Energy Source 2005*
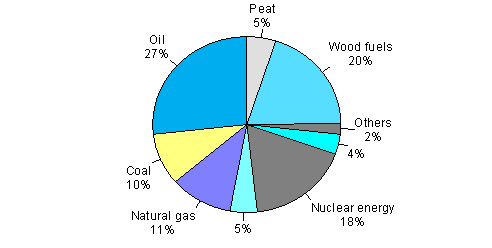
* Preliminary
Consumption of Energy Sources 2004-2005
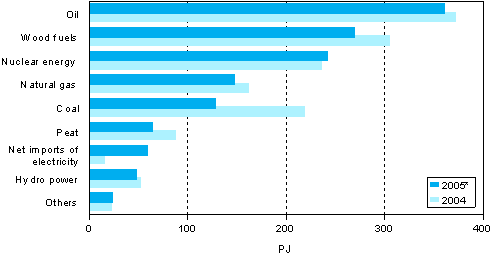
* Preliminary
Consumer prices of liquid fuels rose distinctly during last year. The biggest change concerned the prices of heavy fuel oil, which went up by 48 per cent from January to December. The world market price of crude oil (North Sea Brent) rose by 29 per cent at the same time. In early autumn prices were higher than towards the end of the year as hurricane Katrina wrecked pro duction and refinery capacity in the Gulf of Mexico at the end of August.
The use of renewable energy also fell clearly, by ten per cent from the year before. Its share remained almost on level with 2004, because total consumption of energy decreased almost as much. Of wood fuels, the use of black liquor fell most, by 16 per cent, which was due to the industrial action in the forest industry. The use of wood fuels in industry and small combustion of wood also decreased, as did production of hydro power. As in the year before, production of wind power grew rapidly. Last year it was 0.17 TWh, that is, 40 per cent more than in the previous year. The use of wood pellets also continued to grow.
Fossil Fuels and Renewables 1970-2005
* Preliminary
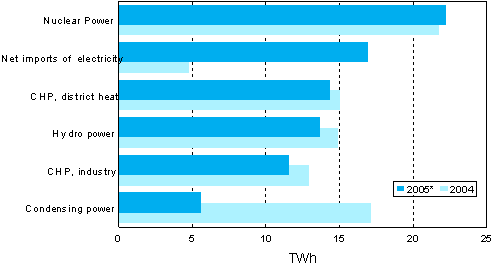
Imports of electricity grew record high
In 2005 consumption of electricity fell exceptionally from the previous year's 87 TWh to nearly 85 TWh, the fall being 2.5 per cent. This was caused by reduced consumption of industry, which was primarily due to the industrial action in the forest industry. Other consumption than that of industry, that is, electricity use of households and services, grew by two per cent. Electricity production contracted considerably more than consumption, by 17 per cent. In particular, production of condensate electricity decreased substantially. The volumes of electricity produced by cogeneration of electricity and heat also declined clearly. More hydro power than average was produced. The production volume was, however, 8.5 per cent lower than in 2004. In contrast, production of nuclear power grew slightly.
Last year more electricity was imported to Finland than ever before, nearly 18 TWh. The exceptional net exports to Nordic countries in 2003 and 2004 turned into net imports. Imports from Russia were on level with the two previous years, when the increased transformation capacity between Finland and Russia has been in use. Net imports grew for that reason to 17 TWh, being as much as 20 per cent of total electricity consumption.
The taxable total prices of electricity (list prices recorded on the 1st day of the month) fell slightly throughout the early part of the year. From early autumn households' prices turned upwards. At the end of last year many electricity companies announced upcoming price increases. In January 2006 the prices of electrical energy for household consumers (without taxes) were from four to nine per cent higher than year before. The prices of the Nordic Power Exchange rose in the early part of the year and after falling in June, they climbed up again in July. The area price for Finland was higher than in the previous year, except in the early part of the year and in June. The average price for December was higher than the monthly average has ever been since the winter 2002 to 2003. As the EU's internal emissions trading started, the price of emission rights has become a new factor influencing the price of electricity.
Electricity Supply 2004 - 2005
* Preliminary
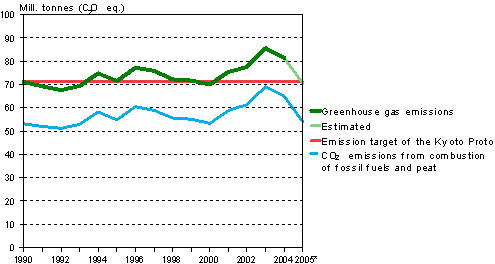
Carbon dioxide emissions fell by 17 per cent
According to Statistics Finland's preliminary data, carbon dioxide emissions of fossil fuels and peat combustion declined in Finland by about 17 per cent from the previous year, amounting to 54 million tonnes in 2005. The decline in emissions was due to reduced total consumption of energy and to that production of condensate electricity was replaced by imports of electricity.
The emissions fell almost to the level they were on in 1990. Total consumption of energy was last year nearly one fifth larger than in 1990. The share of renewable energy sources in total energy consumption has grown and that of fossils decreased, for which reason the difference in carbon dioxide emissions is small. The relative decrease in emissions has also been influenced by growth in consumption of natural gas in relation to other fossil fuels.
Emission Trends 1990-2005
* Preliminary
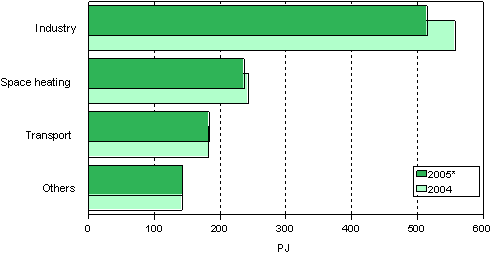
Final consumption of energy fell in industry
Statistics Finland's preliminary data indicate that final consumption of energy fell by four per cent in 2005, amounting to nearly 1,100 PJ. Final consumption of energy measures the consumption of energy end-products, i.e. electricity, district heating, fuels used for space heating, transportation fuels, and industrial processing fuels. The difference between total and final consumption is lost through transformation and transmission losses of energy.
The final consumption of energy in industry fell most last year. The fall is attributable to decreased production in energy-intensive industry. The need for the heating energy of buildings also declined, while the use of energy in transport was unchanged from the previous year.
Final Energy Consumption 2004-2005
* Preliminary
The data concerning the year 2005 are preliminary. Final data will be released in the annual publication Energy Statistics 2005 to be issued in the autumn. The preliminary data are based on information obtained from diverse organisations in the energy sector and on Statistics Finland's data.
Päivitetty 23.3.2006
Suomen virallinen tilasto (SVT):
Energy consumption [verkkojulkaisu].
ISSN=1798-6869. 2005,
Total energy consumption fell clearly
. Helsinki: Statistics Finland [viitattu: 12.6.2026].
Saantitapa: https://stat.fi/til/ekul/2005/ekul_2005_2006-03-16_kat_001_en.html