
Indicators for the circular economy
The indicators demonstrate Finland’s progress towards the circular economy with an emphasis on a business perspective. The collection of indicators was originally produced in 2020 and updated in 2022. Updating will continue in 2023.
The circular economy is often seen as a comprehensive system change. Its achievement requires development across all product and service value chains. To support understanding, the circular economy is described as a set of activities that are pivotal from the perspective of a product or service life cycle. There are eight activities, which encompass a total of 18 indicators.
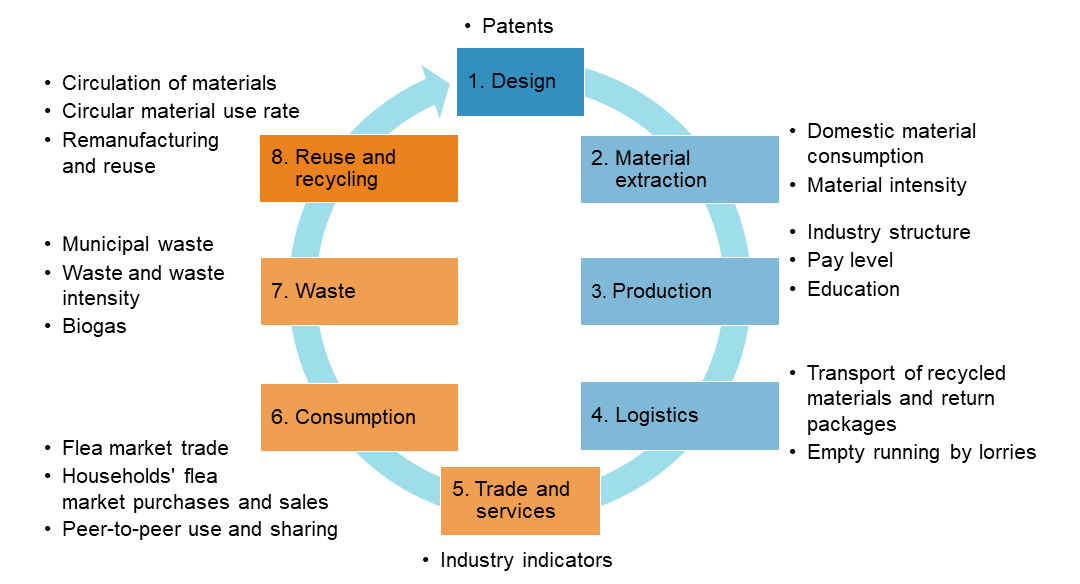
The purpose of division into activities is not to draw strict distinctions between the indicators but to offer a framework for their review. The indicators describe the circular economy from different perspectives, and they are not mutually commensurable or of equal weight. We should examine the indicators as a comprehensive whole – this allows an extensive description of the system-level change.
Some indicators are available as time series and some regionally
In many indicators, the emphasis is on decoupling, and the value of the indicator is tied to economic development, for example. It can thus be ensured that changes in absolute amounts are not caused by a contraction of the economy but by changes in the structure and procedures of the economy.
Existing data have been utilised in producing the indicators, which also enables time series to extend backwards in time. In most of the indicators, the time series covers the years 2013 to 2020, in some the period is even longer. The existing long time series facilitate a retrospective review of new phenomena such as the circular economy.
It has also been possible to produce some of the indicators regionally: these include the number, turnover and personnel of circular economy establishments, and flea market trade.
The indicator material is available in Excel format.
View the indicators
- Design
- Material extraction
- Production
- Logistics
- Trade and services
- Consumption and sharing economy
- Waste
- Reuse and recycling
1. Design
In the circular economy, design and innovation are key components of all activities. Design helps produce materials, products and services based on the circular economy model. Design and innovation can contribute to the prevention of waste production, extending product life cycles and reducing environmental impacts.
Patents related to the circular economy
The indicator includes registered patents that can be classified as circular economy patents per one million population.
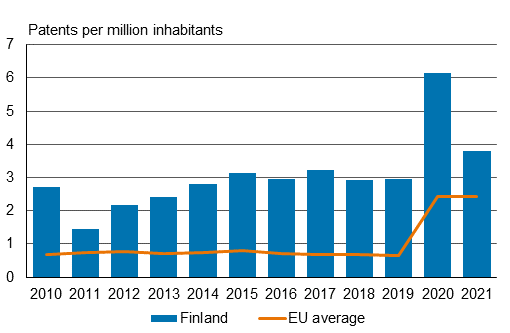
Patents related to circular economy per million inhabitants in 2010 to 2021
The number of patents is commonly used to describe technological progress in different sectors, and it serves as an indicator of the innovation level. Patents related to the circular economy help review the progress of circular economy design and innovations. They paint a big picture of the technological development in the sector because the creation of patents requires the creation of new information and practices. New inventions and practices promote companies’ productivity and competitiveness allowing the development of circular economy industries.
It should be noted that the number of patents is not a comprehensive description of design and innovations in the circular economy business. The significance of patents is particularly emphasised for technological solutions, and innovation and design activities in the service industries may be left in the dark when it comes to patents.
Since the beginning of the 2010s, the number of patents has increased to four patents per million inhabitants. The figures for 2020 and 2021 are preliminary, and the Covid-19 pandemic may help explain the high figures. In Finland, the number of registered patents related to the circular economy per capita significantly exceeds the EU average every year.
The indicator is based on Eurostat’s circular economy indicators and utilises the same definition of the Cooperative Patent Classification (CPC) as the Eurostat indicator. The indicator includes all patents registered each calendar year classified as circular economy patents per million inhabitants. The CPC category definition of patents comprises different patents concerning the treatment of waste and waste water, as well as patents relating to technologies that mitigate greenhouse gas emissions.
Indicator data for 2010 to 2019 are based on Eurostat's information, whereas the data for 2020 and 2021 are preliminary and calculated directly from the database of the European Patent Office (EPO) using the CPC (Cooperative Patent Classification).
2. Material extraction
In a functional circular economy, the demand for virgin natural resources as raw materials decreases as they are replaced with recycled materials. Good planning can also improve the efficiency of production processes and extend the service life of products, and these measures also reduce the consumption of raw materials. Reducing consumption and use of resources lessens the impacts on the environment.
Currently, few statistical classifications distinguish the use of raw materials by source, but natural resources taken into use in the economy can be measured with domestic material use. In addition to the absolute amount, the consumption of natural resources should be examined in relation to economic growth to see whether changes are just a result of cyclical fluctuations in production or an actual development towards the circular economy.
In terms of sustainability, the aim is to attain decoupling, whereby the use of natural resources per euro will grow more slowly than the economy or even decrease. Decoupling can be promoted by servicising the economy and increasing the use of recycled raw materials.
Consumption of domestic materials and material intensity
The consumption of domestic materials includes materials extracted from the Finnish nature, to which the weight of imported goods is added, and from which the weight of exports is subtracted. Material intensity is obtained as a ratio of domestic consumption of materials to gross domestic product.
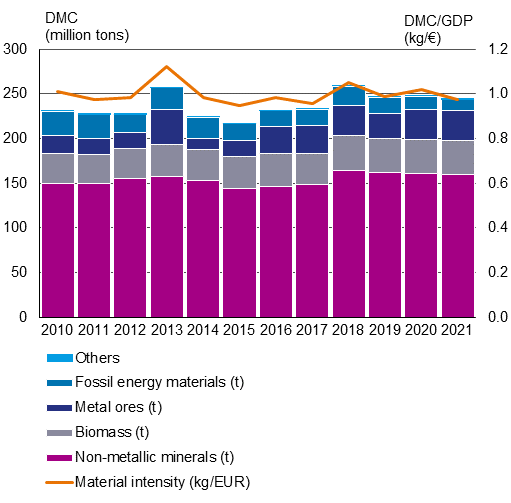
Domestic material consumption by material and material intensity in 2010 to 2021
Various raw materials are extracted from the Finnish nature and used for further processing in the economy. In addition to direct domestic extraction, i.e. materials extracted from the domestic nature, the domestic material consumption (DMC) indicator takes into account materials and products imported from abroad as raw materials or processed products and those exported abroad.
Domestic material consumption is measured in tonnes and can be divided into four material groups: biomass, metal ores, non-metallic minerals and fossil energy materials. It also includes other products that contain materials that cannot be directly classified into the four main categories.
In addition to the total value, the use of natural resources can be examined as a ratio of domestic material consumption to gross domestic product. This produces an indicator of material intensity, DMC/GDP, which indicates how many kilogrammes of natural resources are needed for each value added euro produced. The circular economy aims to reduce material intensity.
The majority of domestic material consumption is made up of non-metallic minerals such as sand and gravel used in construction. Finland also consumes a lot of biomass and especially roundwood for industrial use. Important metal ores include nickel and copper. Finland has no primary production of fossils besides peat, but it processes and imports a significant quantity of oil products.
Between 2010 and 2021, domestic material consumption has varied from around 215 to 260 million tonnes. Consumption was at the lowest level in 2015 but has started to take off since. In 2018, the consumption of materials reached its peak, especially due to the increase in the amount of non-metallic minerals. In the most recent years investigated, consumption has gradually started to decline. In 2021, domestic material consumption was 245 million tonnes, i.e. 44 tonnes per capita.
The material intensity of GDP has varied in Finland, but the trend has been slightly downwards since 2018. That means that fewer materials have been used proportionate to the production volume. The peak material intensity in 2013 was due to an exceptionally high level of metal mining activity.
The consumption of virgin natural resources has declined, and decoupling from economic growth may have begun. This indicates the progress of the circular economy in terms of these indicators.
When interpreting indicators related to material consumption, it should be noted that for the time being, it is possible to compile statistics about international trade only on the weights of products crossing the border. Therefore, for example, the use of natural resources in the country of manufacture of the product remains largely the responsibility of that country, even if consumption took place in Finland. Correspondingly, the consumption of raw materials for export products manufactured in Finland remains mostly visible in Finnish material consumption.
Statistics Finland calculates the value of domestic material consumption as part of the annually published statistics on material economy-wide material flow accounts. Both domestic material consumption and material intensity are UN indicators for sustainable development used to measure the achievement of global UN Sustainable Development Goals. In line with Target 12.2 concerning sustainable consumption, the aim is to achieve the sustainable management and efficient use of natural resources by 2030. DMC is also one of the indicators used to monitor the progress of the circular economy in Finland (Ministry of the Environment).
3. Production
One of the objectives of the circular economy is to reduce raw material consumption and transfer production to more sustainable products and services. The aim of the production indicators is to measure the realisation of the circular economy from the perspective of enterprises and employment.
Circular economy indicators examine both establishment-specific and industry-specific data. The number, turnover and personnel of circular economy establishments serve as establishment-specific indicators. In addition, it is possible to review the progress of turnover by region. Industry-specific indicators include median pay in circular economy industries and persons employed in circular economy industries within one year of graduation by level of education.
Statistical classifications do not currently separate circular economy activities. However, the industry classification helps determine industries that belong to the circular economy. This allows us to distinguish circular economy business from other business areas. Based on the circular economy industries, it is impossible to measure all circular economy activities in the economy, but combined with the present statistics and classifications, they provide a good starting point for measuring. A list of circular economy industries (in Finnish only) can be found in the indicator attachments.
Number, turnover and personnel of circular economy establishments
The indicator includes the number, turnover and personnel of establishments in industries classified as circular economy industries.
Number, turnover and personnel of circular economy establishments in 2013 to 2020
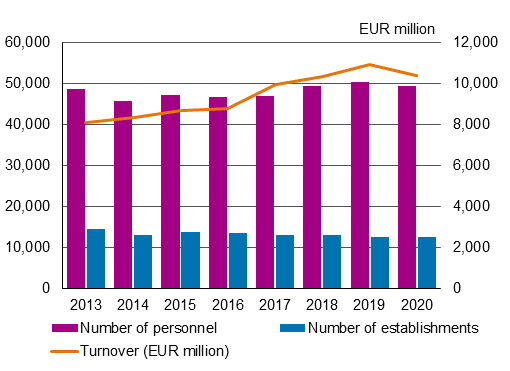
The turnover of circular economy industries has increased during the entire reference period. The number of personnel experienced moderate growth from 2016 until 2019. In 2020, circular economy industries’ turnover decreased by approximately five per cent, and the number of personnel by approximately two per cent, from the previous year. The negative development of personnel and turnover is probably due to the Covid-19 pandemic.
The number of circular economy establishments has declined during the entire reference period. In 2020, the number of establishments was 13 per cent lower than in 2013.
The indicator represents the general development of circular economy industries. Turnover growth indicates positive economic development in circular economy industries in recent years. On the other hand, the decline in the number of establishments may suggest concentration.
The indicator data have been compiled from the data of Statistics Finland’s structural business and financial statement statistics. The indicator data have been compiled from establishment-specific data, and the indicator includes all establishments operating in industries defined as circular economy industries. The indicator thus also covers enterprises in which only part of the activity belongs to the circular economy. It includes establishments in which the turnover and number of personnel exceed 0.
Circular economy business activity by region
The indicator includes the number, turnover and personnel of establishments in industries classified as circular economy industries by region.
Turnover of circular economy establishments by region in 2013, 2017 and 2020
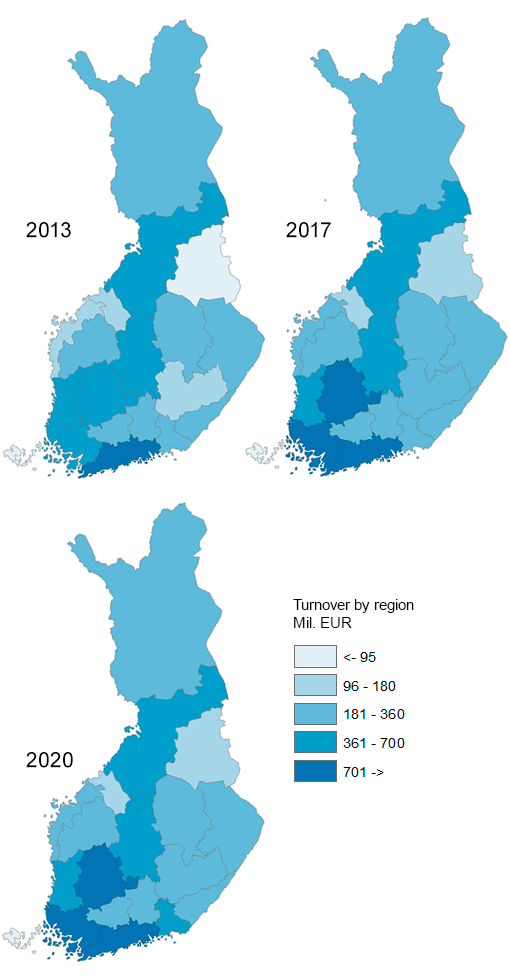
Except for Åland, the turnover of circular economy establishments has increased in all regions since the beginning of the reference period. Turnover growth was highest in Southwest Finland, where it has increased by 50 per cent since 2013, amounting to 855 million in 2020. Turnover increased by nearly 50 per cent in Kainuu and Pirkanmaa.
Correspondingly, the number of personnel has increased most in Central Finland, Kainuu and Pirkanmaa. The number of establishments has decreased in all regions. The decline has been slowest in North and Central Ostrobothnia. In absolute terms, turnover, number of personnel and number of establishments were highest in Uusimaa, with a turnover of EUR 3,700 million in 2020.
The indicator data have been compiled from the data of Statistics Finland’s structural business and financial statement statistics.
Pay level in circular economy industries
The pay level in circular economy industries can be described by comparing the median pay in circular economy industries to the median pay in the whole economy.
Median pay of circular economy industries and all industries in 2010 to 2020
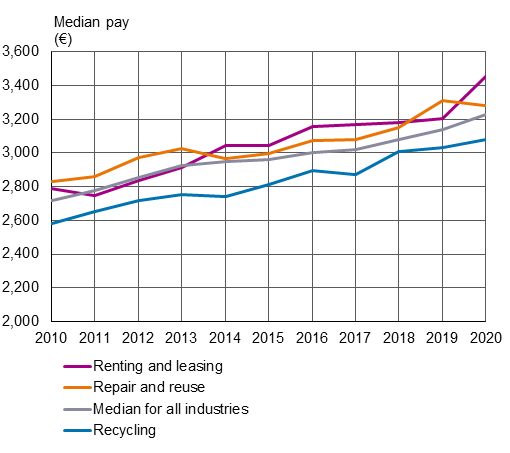
Pay development in circular economy industries has largely been in line with the general pay development. In both the rental and leasing industry and the repair and reuse industry, the median pay is slightly higher than median pay in general.
In contrast, the median pay is lower than in general in industries related to recycling. In 2020, the median pay in the rental and leasing industry increased significantly, but pay development was more moderate in recycling. In comparison, pay in the repair and reuse industry took a downward turn.
In 2020, the median pay in all industries was EUR 3,200, compared to EUR 3,300 in the repair and reuse industry and EUR 3,500 in the rental and leasing industry. In the recycling industry, median pay was EUR 3,100.
Median pay has been calculated from the total earnings of full-time employees in circular economy industries and the economy as a whole. Companies with fewer than five employees are not included in the indicator.
The indicator data have been compiled from the data of Statistics Finland’s structure of earnings statistics.
Persons employed in circular economy industries by level of education
The education indicator describing the educational background of persons employed in circular economy industries aims to describe the jobs generated in circular economy industries.
Persons employed in circular economy industries within one year of graduation by level of education in 2010 to 2020
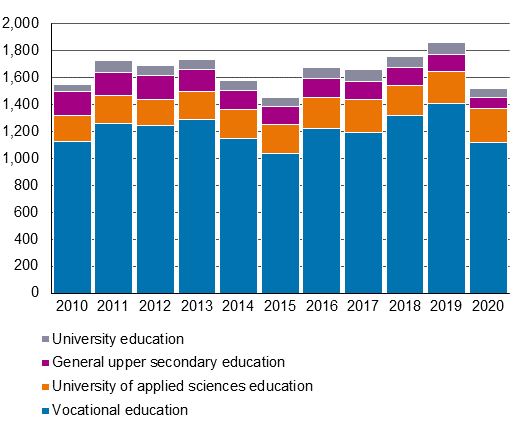
The indicator describes the level of education and numbers of persons employed in circular economy industries within one year of graduation. The number of persons employed in circular economy industries has increased since the decline in 2015, from around 1,500 employed persons to 1,900 in 2019. In 2020, the number of persons employed in the circular economy fell to 1,500, amounting to the highest decline during the reference period.
The most common level of education is vocational education, which accounted for 74 per cent of persons employed in circular economy industries in 2020. The share of vocational education has remained more or less stable throughout the reference period. The second most common educational level, which has witnessed the most growth in recent years, is university of applied sciences education. It accounted for 16 per cent of persons employed in circular economy industries in 2020. However, the share of those who have only completed general upper secondary education has dropped from 11 to 5 per cent. University graduates accounted for the lowest number of persons employed in circular economy industries within one year of graduation, at less than five per cent.
The large share of vocational education is partly explained by the fact that the indicator describes employment within one year of graduation. Vocational education includes training courses in which students graduate directly to circular economy industries. Because the indicator measures persons employed within one year of graduation, students graduating from those training courses are more likely to be directly employed in those industries. It may take longer for those graduating from other levels of education to transfer to circular economy industries.
The indicator was produced from the data of Statistics Finland’s statistics on the transition from school to further education and work.
4. Logistics
The circular economy requires efficient management of material flows and new logistics solutions. Functional logistics solutions are a prerequisite for the success of several new business models for the circular economy. Unlike in the linear economy, in the circular economy, materials do not become waste by default but circle in the economy, and this calls for functional logistics. For example, the reuse of used products and materials often requires them to be transported from one place to another.
The role of reverse logistics should also be considered in the circular economy. The current logistics system focuses mainly on the distribution of new products. However, the circular economy also calls for increasing reverse logistics in which more and more materials and products are returned to repairers, producers and retailers. This is a key prerequisite for the reuse of products and the extension of their useful life.
Transport of recycled materials and return packages
The indicator represents the volume of recycled materials and empty return packages transported by lorries and the average transport distance.
Transport of recycled materials and return packages in 2011–2021
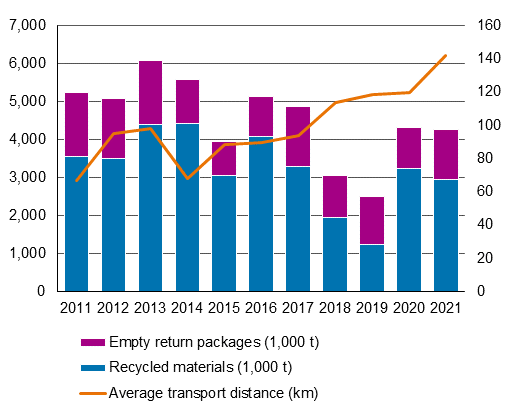
The circular economy requires the use of virgin materials to be reduced and used materials to be reused. The transport indicator for recycled materials and return packages represents the volume of materials and goods to be reused in lorry transport. Recycled materials include transports of various recycled materials such as recovered paper. Empty return packages include empty containers, pallets, trolleys, return bottles and other packaging materials.
The number of transports of recycled materials was in decline until 2019, when the volume of transported recycled materials slightly exceeded one million tonnes per year. Since 2019, the transported volumes of recycled materials have increased to approximately three million tonnes. There has been a moderate decline in the number of transported return packages since the beginning of the reference period, but the amount has stabilised to approximately one million tonnes per year in recent years.
Compared to the total volume in lorry transport, the volume of recycled materials and return packages has remained stable, apart from 2019.
The average length of transport distance for recycled materials and recycled packages has witnessed steady growth since 2014. Here, the recycled materials and return packages also follow the general trend because the average distance of all transports has increased steadily since 2014. This is probably because the maximum allowed total mass of lorries was increased in 2013. The average transport distance of recycled materials and return packages is significantly longer than that of all goods transports. For example, the difference was 50 kilometres in 2021.
Multiplying the volume of transported goods by the transport distance equals transport performance (tonne-kilometres), which characterises the amount of transport work. The transport performance of recycled materials has varied year by year, but the trend has been downwards. The transport performance of recycled material reached its lowest point in 2019, amounting to 214 million tonne-kilometres. However, in 2021, it increased considerably to 600 million tonne-kilometres. Similarly, the transport performance of empty return packages varies year by year, and a small decrease has been observed. It reached a low in 2016, when the transport performance of empty return packages slightly exceeded 130 million tonne-kilometres. In 2021, the transport performance of return packages was 218 million tonne-kilometres.
A slight increase can be observed for both types of goods but the transport performance of all types of goods has witnessed a steady decline during the reference period. The conflicting trends of recycled materials and return packages may indicate either that both types of transport have become more efficient, or the volume has reduced.
The indicator data have been compiled from the data of Statistics Finland’s statistics on goods transport by road.
Empty running by lorries
The indicator represents the share of empty running of all lorry transport.
Empty running by lorries in 2011–2021
The circular economy requires new practices to make transport routes and material flows more effective. This may mean better planning and more efficient transport, as well as the optimal utilisation of return journeys for goods transports.
The indicator for the share of empty running of all lorry transport shows how systematic and efficient the logistics operation is. A low share of empty running can be due to well-planned and efficient logistics in the circular economy.
The share of empty running of all goods transported by lorry reached its peak in 2014, amounting to 29 per cent. The share of empty running then declined until 2018, when it amounted to 20 per cent of all transports by lorry. In the last three years, the share of empty running has begun to increase, and in 2021, more than 25 per cent of all lorry traffic was driven without a load.
The indicator data have been compiled from the data of Statistics Finland's statistics on goods transport by road.
5. Trade and services
One objective in the circular economy is to reduce consumption and change consumption habits from consumption of products to consumption of services. This can be described with the share of service industries of the economy.
Share of turnover from service industries
The indicator describes the share of turnover from service industries in the whole economy.
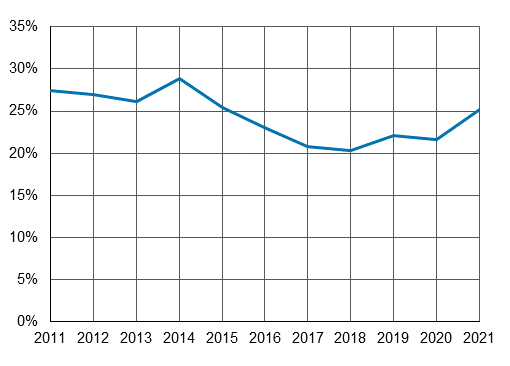
Share of turnover in service industries in the whole economy in 2013 to 2020
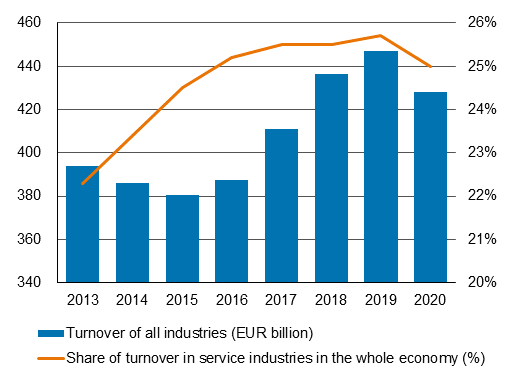
Turnover indicates the volume of business in service industries. Comparing turnover to that of all industries shows the size of the service industries relative to the whole economy. When moving from the linear economy to the circular economy, the consumption of goods should decrease, and the consumption of services increase. This change can be measured by comparing the share of service industries to the turnover of the whole economy.
The share of service industries saw a moderate increase until 2016 and evened out afterwards. However, in 2020, the share of service industries of the whole economy decreased. This decrease is probably explained by the restrictions introduced because of the pandemic, which had a significant impact on several service industries.
The turnover of all industries has grown steadily from good EUR 380 billion in 2015 to nearly EUR 450 billion in 2019. In 2020, the Covid-19 pandemic decreased the turnover of all industries to slightly less than EUR 430 billion.
The indicator was produced from the data of Statistics Finland’s structural business and financial statement statistics. The TOL2008 categories from transport and storage to other service activities (H to S, excluding category K Financial and insurance activities) are classified as service industries.
6. Consumption and sharing economy
The consumption and sharing economy activity includes indicators that describe the circular economy from the perspective of consumers. For example, the transition to the circular economy requires a transition to the sharing economy: the possibility to use goods, services and other commodities is more important than owning them.
The sharing economy can be considered a circular economy, especially when it reduces the use of virgin raw materials and the need for new products. The consumption and sharing economy includes three indicators: flea market trade, purchases and sales at flea markets, and sharing and peer-to-peer use.
Flea market trade
The flea market trade indicator describes the turnover of enterprises operating in flea market industries and their numbers of establishments and personnel.
Number, turnover and number of personnel of establishments in flea market industries in 2013 to 2020
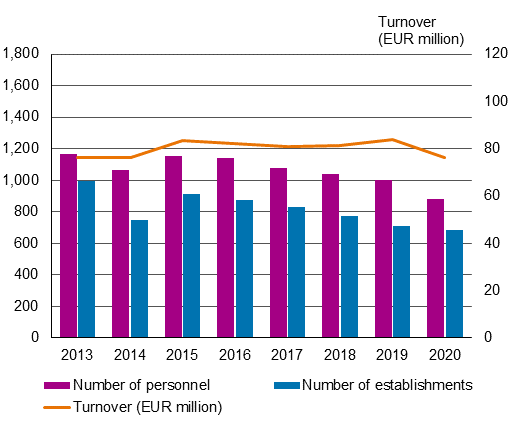
The turnover of flea market trade has shown a very moderate increase since 2015. In 2020, the turnover of flea market trade plummeted by nine per cent from the previous year to almost the level of 2014. The number of personnel and establishments has decreased moderately throughout the reference period. The changes indicate a regression of conventional flea market trade.
The turnover of flea market trade does not directly measure the money spent or earned in flea markets, as it does not necessarily directly transfer to the turnover of the enterprise operating the flea market.
The indicator includes enterprises' establishments that operate in the following industries:
- 47791 Antiques shops
- 47792 Second-hand bookshops
- 47793 Auction houses
- 47799 Retail sale of other second-hand goods in stores
The indicator data have been compiled from data on establishments of enterprises. The indicator includes all establishments reported to operate in the above industries. Thus, the indicator also covers enterprises where only part of the activity takes place in the industries concerned. Only establishments with a turnover and number of employees of over 0 are included. Data from Åland have not been included in the indicator for data protection reasons.
The indicator was produced from the data of Statistics Finland's structural business and financial statement statistics.
Flea market trade by region
The indicator includes the turnover of enterprises operating in flea market industries and the numbers of establishments and personnel by region.
Number of flea market establishments by region in 2013, 2017 and 2020
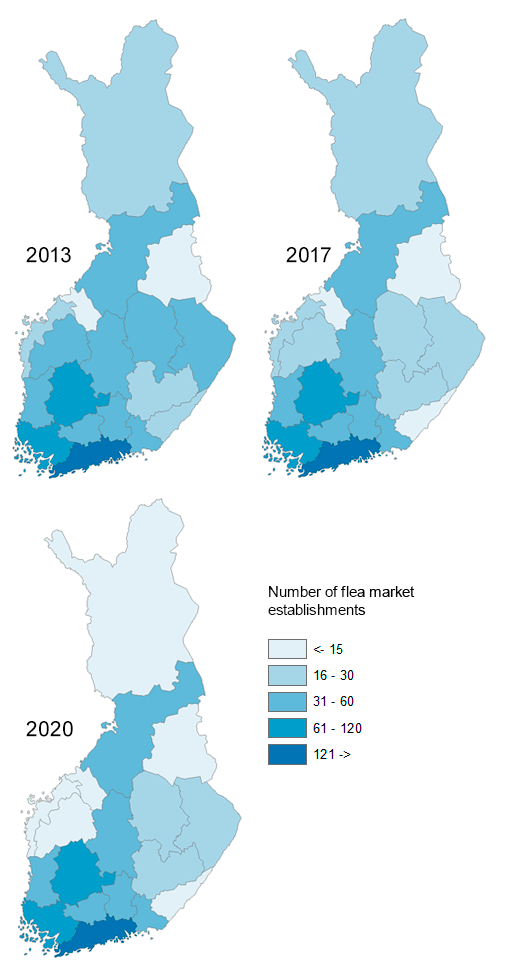
During the reference period, the number of establishments has increased only in Central Ostrobothnia, where their level was nearly 30 per cent higher than in 2013. The decline from 2013 was the smallest in Kanta-Häme, at two per cent, and in Satakunta, at nearly 15 per cent.
In 2020, the turnover was higher than in 2013 in seven regions: Central Ostrobothnia, Southwest Finland, Satakunta, Kymenlaakso, North Karelia, North Ostrobothnia and Uusimaa. The greatest increases were in Central Ostrobothnia, Southwest Finland and North Karelia.
The number of personnel has increased only in North Karelia, by two per cent, and in Southwest Finland, by one per cent. In the other regions it has decreased.
The indicator includes enterprises' establishments that operate in the following industries:
- 47791 Antiques shops
- 47792 Second-hand bookshops
- 47793 Auction houses
- 47799 Retail sale of other second-hand goods in stores
The indicator data have been compiled from data on establishments of enterprises. The indicator includes all establishments reported to operate in the above industries. Thus, the indicator also covers enterprises where only part of the activity takes place in the industries concerned. Only establishments with a turnover and number of employees of over 0 are included. Data from Åland have not been included in the indicator due to data protection issues.
The indicator was produced from the data of Statistics Finland's structural business and financial statement statistics.
Households’ purchases and sales at flea markets
The indicator for purchases and sales at flea markets describes households’ average annual purchases and sales in different types of flea markets in 2019.
Households’ average annual purchases and sales in different types of flea markets in 2019
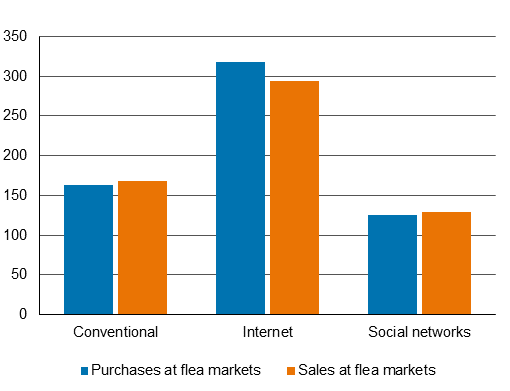
The indicator divides flea markets into three groups: conventional flea markets, online flea markets and social network services. Households' purchases and sales are clearly focused on online flea markets. Conventional flea markets and social network services are almost at the same level, as the share of conventional flea markets is only slightly higher.
The indicator data have been collected from Statistics Finland’s experimental statistics on the phenomena of the peer-to-peer and sharing economy in households.
Peer-to-peer use and sharing
The indicator represents the use of rental, peer-to-peer and shared vehicles by households and peer-to-peer accommodation in 2019.
Use of rental, peer-to-peer and shared vehicles in Finland and abroad in 2019
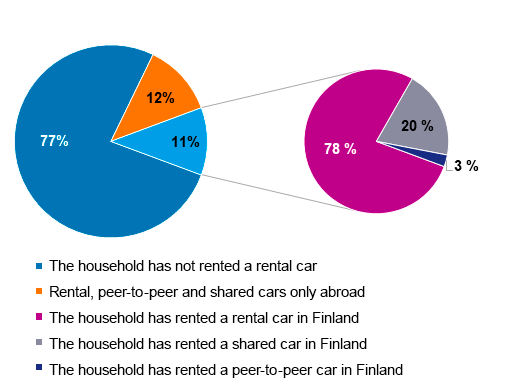
Peer-to-peer renting is at the core of the sharing economy. The rental of products such as vehicles or tools increases their utilisation rate, decreasing the need for new products. The indicator shows the share of households which used peer-to-peer or shared vehicles and the share of households which rented peer-to-peer accommodation for their use within the last 12 months in 2019.
Only 11 per cent of households rented a car for domestic use. Most of the cars rented in Finland consisted of conventional car hire. Twenty per cent of households which rented a car in Finland rented a shared car, and under three per cent a peer-to-peer car. Only two per cent of all households rented a shared car, and only 0.3 per cent a peer-to-peer car.
Peer-to-peer accommodation in Finland and abroad in 2019
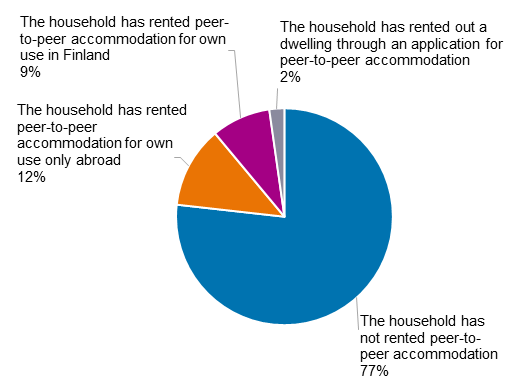
Most households did not rent peer-to-peer accommodation for their own use in 2019. Nine per cent of households rented peer-to-peer accommodation for their own use in Finland, and 10 per cent rented peer-to-peer accommodation only abroad.
Only three per cent of households rented out their primary or secondary residence, investment apartment or holiday home through an application for peer-to-peer accommodation within 12 months. The average income from peer-to-peer renting of an apartment within 12 months amounted to EUR 2,300.
The indicator data have been collected from Statistics Finland’s experimental statistics on the phenomena of the peer-to-peer and sharing economy in households.
7. Waste
Prevention of waste generation is central to the circular economy, where the aim is to keep the value of materials and products in circulation for as long as possible. The indicators related to waste are recovery of municipal waste, total amount of waste and waste intensity, as well as production and utilisation of biogas.
If the amount of waste decreases or growth of its volume slows down, it may mean that prevention of waste generation has become more efficient. Monitoring the amount of waste shows what amount of waste has been collected and transported for waste treatment. Examined by treatment method, it is possible to evaluate the business activity of waste treatment plants operating in the circular economy and its change.
Biodegradable waste is used to produce biogas that can be utilised as fuel in energy production and transport. In this way, methane otherwise released into air in the decomposition process can be obtained for recycling. According to the waste hierarchy, material recovery of biodegradable waste is a better alternative than incineration.
Recovery of municipal waste
Municipal waste refers to waste generated in housing, as well as comparable waste from trade and services and corresponding waste from industry support activities. In addition to the amount of municipal waste, its material and energy recovery have been selected for the indicator.
If the product can no longer be repaired or reused, the next best option from the circular economy perspective is recycling as material – that is, the product’s materials are used to make recycled materials, decreasing the need for virgin raw materials. If recycling is not possible, energy recovery is a better alternative than landfilling. Energy recovery should primarily be used to replace landfills, not recovery of materials. Both material and energy recovery can increase business.
Amount of municipal waste divided by treatment modes and recycling rate of municipal waste and EU average in 2010 to 2021
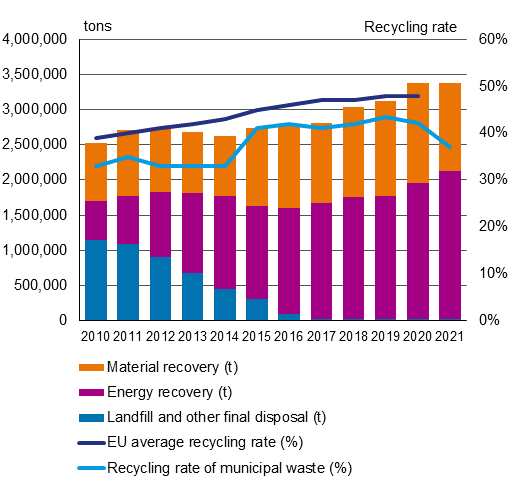
Municipal waste refers to waste generated in housing as well as comparable waste from trade and services and corresponding waste from industry support activities. In addition to the amount of municipal waste, its material and energy recovery has been selected for the indicator.
If the product can no longer be repaired or reused, the next best option from the circular economy perspective is recycling as material, that is, the product’s materials are used to make recycled materials, decreasing the need for virgin raw materials. If recycling is not possible, energy recovery is a better alternative than landfilling. It should be seen as a substitute for landfill sites, not material recovery.
The amount of municipal waste has grown during the reference period. In 2021, the amount was 3.4 million tonnes, which equates to 609 kg of municipal waste per capita.
The recycling rate of municipal waste has remained at 41 to 43 per cent since 2015. The EU average is significantly higher: 48 per cent in 2020. However, in 2021, the recycling rate in Finland saw a significant fall to 37 per cent. Instead of material recovery, a larger share of waste was directed to energy recovery. This was partly due to the increased share of mixed waste and reduced separate collection. According to the new waste regulation, at least 55 per cent of municipal waste should be recycled in 2025, and 60 per cent in 2030, and as much as 65 per cent in 2035. This means the goal is far away.
All municipal waste indicators can be found directly in Statistics Finland’s data. They have been collected as a time series from 2010 to 2021. The data are published annually. Municipal waste is also part of Eurostat’s indicators on the circular economy.
Total amount of waste and waste intensity
The total amount of waste represents the amount of waste removed from the materials cycle and the development of the amount. In the circular economy, the aim is to design products to eliminate or minimise the production of waste. The indicator of waste intensity describes the ratio of waste to gross domestic product.
The circular economy aims for decoupling: the smaller the waste intensity, by default the more products and services have been produced with lower emissions from waste. An examination of the time series, in turn, indicates whether society has been able to generate more wealth and reduce the amount of waste at the same time. The indicator has been compiled as a similar time series as material intensity since 2010. The indicator data are directly derived from Statistics Finland’s statistics.
Total amount of waste and total waste intensity and without mining waste between 2010 and 2020
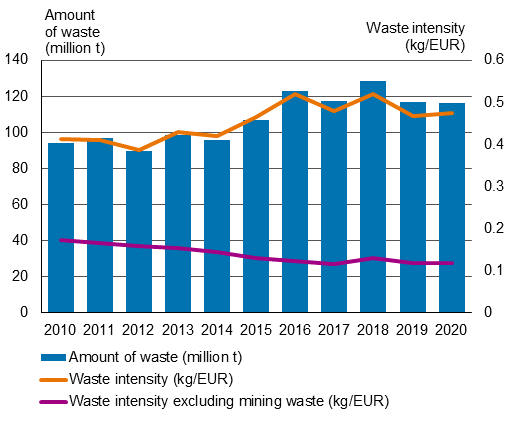
The majority of Finland’s waste, around 90 per cent (2020), is mineral waste generated from mining and quarrying and construction, most of which is stockpiled in landfills. Waste placed in a landfill is not recovered. Statistics Finland compiles statistics on both the generation of waste by industry and on the methods of waste treatment. The total amount of waste increased until 2018, amounting to 128 million tonnes. In recent years, the amount decreased to close to 115 million tonnes.
Similarly, waste intensity increased in Finland until 2018 and then began to decrease with the decline of the amount of waste. Without taking into account mining waste, the time series shows a downward trend. However, mining waste is part of the total amount of waste in Finland. From the perspective of the circular economy, it will be essential to recover mining waste instead of placing it in a landfill.
Waste intensity is also one of Eurostat’s indicators for the circular economy. It is calculated as a ratio between generation of waste and GDP, but without the biggest items of mineral waste due to fairer comparability of countries.
Production and utilisation rate of biogas
The production and utilisation rate of biogas describe how much biogas has been produced and how much demand there is – that is, how much biogas has been utilised.
Production and utilisation of biogas and flaring of non-utilised share of biogas in 2010 to 2021
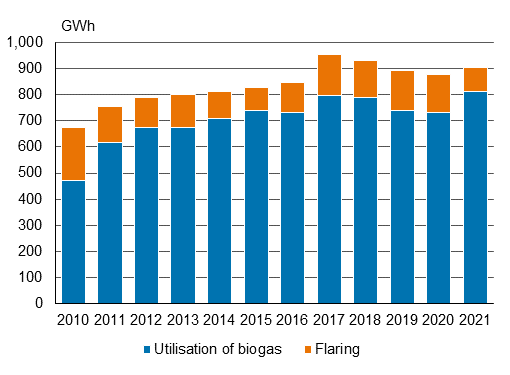
Biogas is produced through a decay process from biowaste, sewage sludge, landfill gases, manure, industrial by-products and plant-based biowaste. When utilising materials that are otherwise consumed as waste, the production of biogas is an essential part of the circular economy. Biogas can be used to replace natural gas, i.e. the use of fossil fuels. In addition, nutrient-rich sludge is generated as its by-product, which can be used as a fertiliser in place of conventional fertilisers. Biogas is mainly used for the production of electricity and heat.
Between 2010 and 2016, the production of biogas increased from 680 GWh to 850 GWh. In 2017, the production volume was 950 GWh, followed by a decrease until 2020. In 2021, production increased somewhat and was 905 GWh. Increased production means that side streams are utilised more if the volume of side streams remains unchanged.
The utilisation rate of biogas describes how much of produced biogas has been utilised, that is, what kind of demand biogas has. As a backup solution, excess biogas has to be flared, whereby it is wasted. For several years, the utilisation rate of biogas was approximately 85 per cent. In 2021, the utilisation rate rose to 90 per cent when the share of flaring decreased.
The reduction in the amount of landfilled waste has reduced the production of biogas. On the other hand, the production volumes of biogas may increase as separate collection becomes more efficient. Agricultural inputs are considered to have a lot of untapped biogas potential.
Statistics Finland has collected biogas data since 2017. The data up to 2017 are from the Finnish biogas plant register (University of Eastern Finland, in Finnish)). Methodologically, the calculations differ slightly from one another.
8. Reuse and recycling
The circular economy aims to reduce the use of virgin raw materials by replacing them with recycled materials. When materials circulate in the economy for as long as possible, resources are saved and less emissions are produced. The cycle of natural resources, materials and waste is described in the circulation of materials indicator. The circular material use rate indicator measures the ratio of recycled material to the overall material use.
Extending product life cycles is an essential part of the circulation of materials. If a product can no longer be reused as such, remanufacturing is the next best option according to the circular economy model. In remanufacturing, the product is updated or produced again into at least as good as a new corresponding product.
The remanufacturing indicators describe the extension of the product’s life cycle, using the re-treading of vehicle tyres and circulation of electrical and electronic waste as examples. Compared to a new product, remanufacturing conserves natural resources and energy.
The reuse and recycling indicators are closely related to waste indicators. When a product is no longer used, it can be recycled as such, repaired to as-new condition, or recycled as material or waste. Material recovery from waste is explained in connection with the indicator describing the treatment methods of municipal waste.
Circulation of materials
The circulation of materials in the economy can be described by the use of domestic natural resources, waste treatment and emissions.
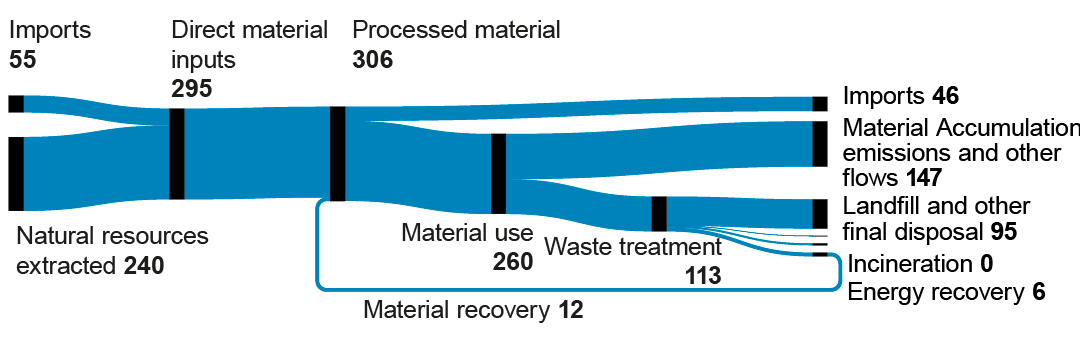
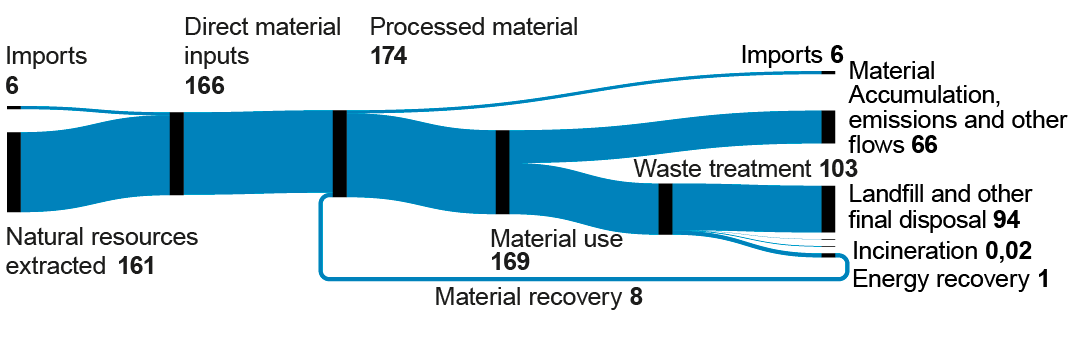
The material flow chart illustrates virgin materials extracted from nature during the calendar year, their use and their ending up in different waste treatment processes. The chart takes into account the imports and exports of materials and the return of recycled waste to circulation. Material reserves, emissions and other flows are calculated and based on the amount of material that does not end up in waste treatment during the calendar year – that is, which is stored as material or ends up in the air as an emission, for example. The figures are expressed in million tonnes.
For the time being, only a very small proportion of all used materials comes from recycling. In the circular economy, the share of material recovery should increase, while the amount of landfilling and emissions in particular should decrease. Similarly, the extraction of natural resources should decrease. The circulation of materials only illustrates physical circulation and not changes in the consumption patterns, for example.
Circulation of materials described in the Sankey diagram for the statistical reference year 2020

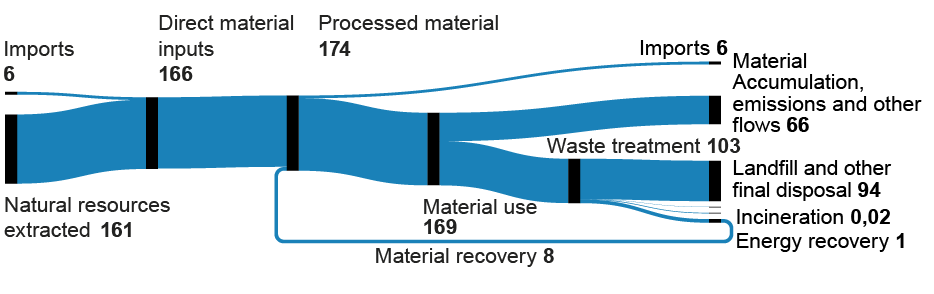
Circulation of non-metallic minerals described in the Sankey diagram for the statistical reference year 2020
In 2020, the amount of extracted natural resources totalled 240 million tonnes. Combined with imports, the direct inputs of natural resources amounted to 295 million tonnes. Only 12 million tonnes, i.e. four per cent of all material used domestically or exported, originated in recycling. Altogether 84 per cent of waste is placed in landfill.
Most of Finland's material flows are non-metallic minerals. The second figure shows their calculated circulation during a calendar year. As you can see, imports and exports are less significant for heavy minerals than for other materials on the average. The share of landfilling is higher because they have thus far been unsuitable for recycling.
Table data for the calculated circulation of all material categories are available in the Excel sheet on the page. It should be noted that material-specific data are not fully comparable due to the different classifications used for waste and materials, as well as imported and exported products, for example. The data on material use are based on the annually published statistics on economy-wide material flow accounts and waste treatment data on waste statistics.
Circular material use rate
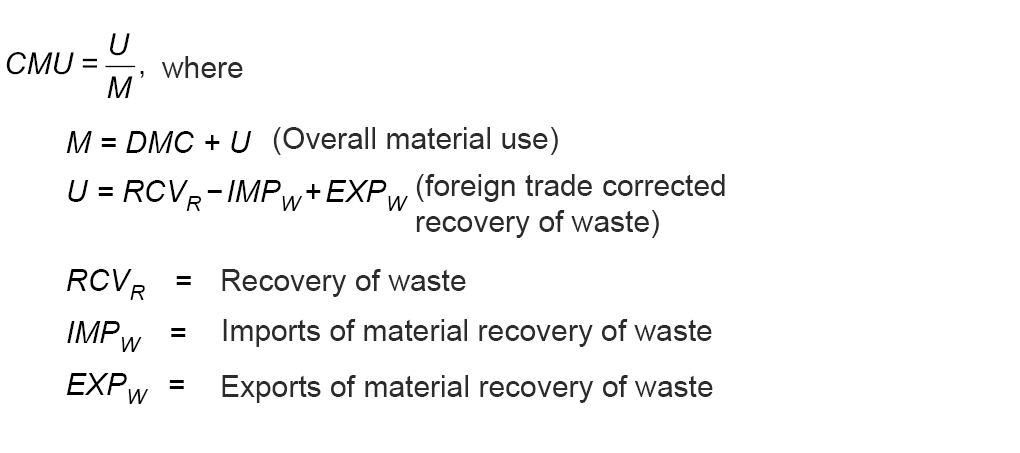
The circular material use rate (CMU) measures the ratio of the circular use of materials to the overall material use. The calculation takes into account the effects of imports and exports of material recovery of waste.
Circular material use rate by material and in total in 2013 to 2020, and EU average
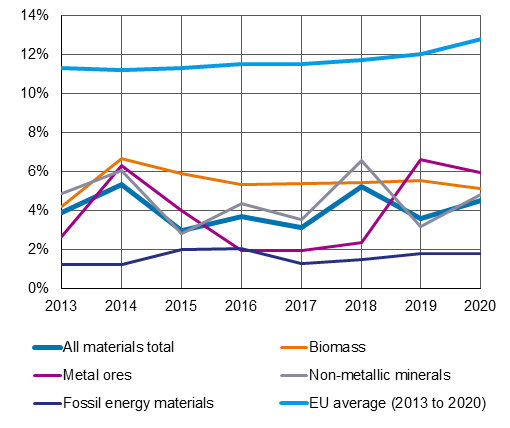
The circular material use rate (CMU) measures the ratio of the circular use of materials to the overall material use. The calculation takes into account the effects of imports and exports of material recovery of waste.
Calculation formula for the circular material use rate
 The higher the circular material use rate, the more recycled materials have been able to replace the need for virgin raw materials, and the smaller the burden on the environment. Reducing the use of virgin raw materials and replacing them with recycling is a key element of the circular economy.
The indicator was compiled as a time series for 2013 to 2020 and additionally divided into material categories according to economy-wide material flow accounts: biomass, metal ores, non-metallic minerals and fossil energy materials. In 2020, the circular material use rate in Finland was 4.5 per cent: higher than at the beginning of the year but lower than in 2018. Examined by material, metal ores have the highest circular material use rate.
The circular material use rate in Finland is significantly below the EU average. However, the economic structure of different countries has a significant effect on comparability – Finland has a high domestic material consumption compared to other EU countries due to the large volume of mining and quarrying. The EU average has grown slowly throughout the reference period.
The model is developed by Eurostat and the figure is not produced regularly at Statistics Finland. However, the figures needed in the calculation can be obtained from Statistics Finland's databases. The circular material use rate is monitored as part of the Finnish programme to promote a circular economy (Ministry of the Environment). It is also one of Eurostat’s indicators for the circular economy.
Remanufacturing and reuse
Remanufacturing is illustrated by the re-treading of heavy vehicle tyres. Reuse is illustrated by the amount of electrical and electronic waste reused and used as material.
Value and number of re-treaded tyres between 2013 and 2021
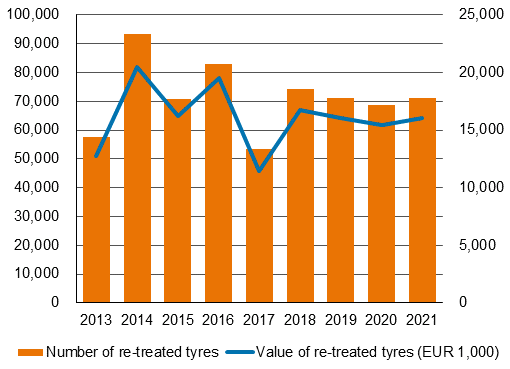
One typical remanufactured product is a car tyre. The re-treading of tyres reduces tyre waste and conserves natural resources such as oil and rubber. Especially heavy vehicle tyres are re-treaded in Finland. The value of the sold production of re-treaded tyres used on buses and lorries has varied between EUR 10 and 20 million between 2013 and 2021. In recent years, the value has remained at approximately EUR 16 million.
The number of re-treaded tyres has varied year by year. The changes in both the value and the amount are parallel. This shows that the value of re-treading has not increased.
The indicator data are derived from Statistics Finland’s statistics on industrial output, which use the PRODCOM classification used in the EU for the classification of industrial products.
Electrical and electronic waste reused and recycled as material between 2013 and 2021
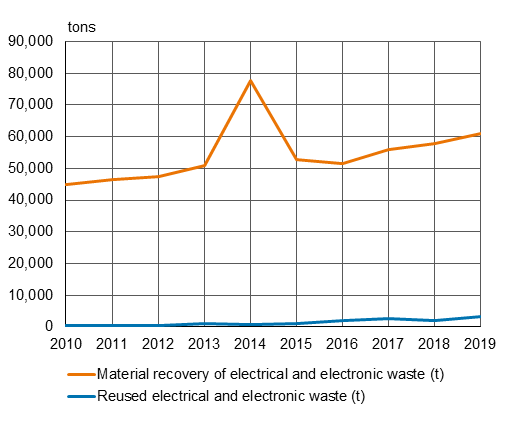
Electrical and electronic waste is an important material resource, as digitalisation and the green transition call for an increased number of various metals. Electrical and electronic waste can be recycled as material and prepared for reuse. Reuse reduces electrical and electronic waste and conserves virgin natural resources.
Preparation for reuse refers to preparing a product removed from use or its components so that they can be reused without any other pre-processing. In 2019, the volume of electrical and electronic equipment prepared for reuse amounted to 3,300 tonnes. The time series is not fully comparable due to the amendment of the Directive in 2019. In previous years, the statistics included the volume of equipment reused as a whole or as components.
Except for 2014, the volume of materials recovered from electrical and electronic waste has increased steadily for the last decade. In 2019, a total of 61,000 tonnes of e-waste were utilised. In Finland, the volume of electrical and electronic equipment per capita ranks among the highest in Europe.
The indicator data are derived from the producer responsibility data compiled by the Centre for Economic Development, Transport and the Environment for Pirkanmaa (in Finnish).
Download data
Download indicator data (xlsx)
Download regional indicator data (xlsx)