

This set of statistics has been discontinued.
New data are no longer produced from the statistics.
Appendix figure 1. Municipalities’ internal investment acquisition costs, net investments and annual contribution margin in 2008 to 2018*
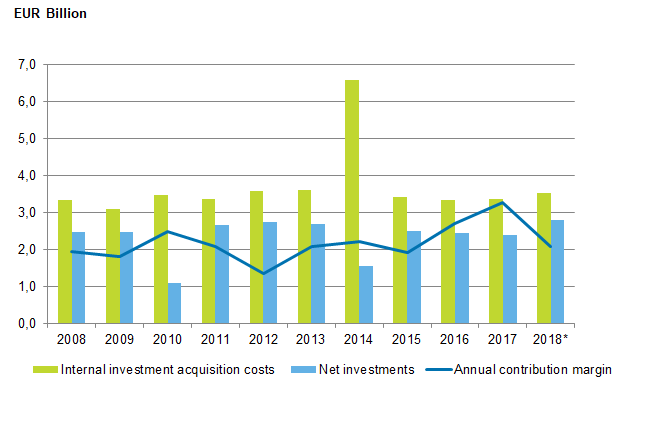
*) The data concerning 2018 are preliminary. Internal investment acquisition costs are the difference between investment expenses and financing contributions. Net investments are the difference between internal investment acquisition costs and proceeds from transfers of non-current assets.
Source: Local government finances 2018, preliminary data. Statistics Finland
Inquiries: Karen Asplund 029 551 3611, Jens Melfsen 029 551 2578, kuntatalous@stat.fi
Director in charge: Ville Vertanen
Updated 31.5.2019
Official Statistics of Finland (OSF):
Local government finances [e-publication].
ISSN=2343-4163. 2018,
Appendix figure 1. Municipalities’ internal investment acquisition costs, net investments and annual contribution margin in 2008 to 2018*
. Helsinki: Statistics Finland [referred: 29.4.2024].
Access method: http://www.stat.fi/til/kta/2018/kta_2018_2019-05-31_kuv_001_en.html