Published: 20 April 2020
Almost every third household had a pet in 2016
Preliminary data on the Household Budget Survey data for 2016 were released midway through the data collection, and the majority of them also corresponded to the completed data. However, the number of dogs and the prevalence of carbon offsets by airline passengers, for example, were reviewed based on the completed data.
According to the completed data of the Household Budget Survey, around 31 per cent of households had a pet, most commonly dogs and cats. There were around 700,000 dogs and around 590,000 cats in Finland.
There were 509,000 households owning a dog in 2016, which was as much as 60,000 more than in 2012. The number of households with cats had also increased, although more moderately. There were around 371,000 households owning a cat in 2016, which was around 15,000 more than in 2012.
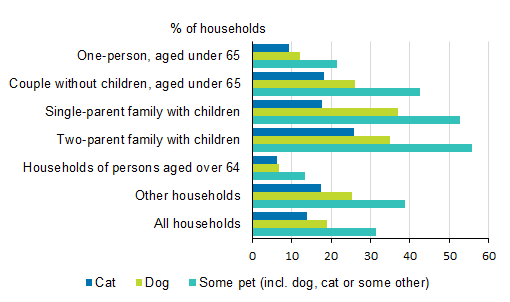
Shares of households with pets by type of household (2016)

Source: Household Budget Survey 2016
The figure describes the share of households with pets by type of household. A household with any kind of pet is recorded as a household with pet in the statistics. Dog and cat households include households with at least one dog or cat. Households with both a dog and a cat are included in both dog and cat households.
Almost every third household had a pet in 2016. It was most common to own a pet in families with children. Fifty-six per cent of two-parent families with children and 53 per cent of single-parent households had a pet. Twenty-six per cent of two-parent families with children had a cat, while 35 per cent had a dog. Eighteen per cent of single-parent households had a cat and 37 per cent a dog.
Among those living alone, 22 per cent had a pet, nine per cent a cat and 12 per cent a dog. The shares for couples without children were almost double: 42 per cent had a pet, 18 per cent had a cat and 26 per cent a dog. Households of people aged 64 or over owned least pets. Thirteen per cent of them had a pet, seven per cent a dog and six per cent a cat.
Increasingly more spent on pets
The average amount of money spent by households on pets has grown over time. Altogether, Finnish households spent good EUR 925 million on pets in 2016. This includes purchases of new pets, food, supplies, medication, insurance, veterinary services and other pet services.
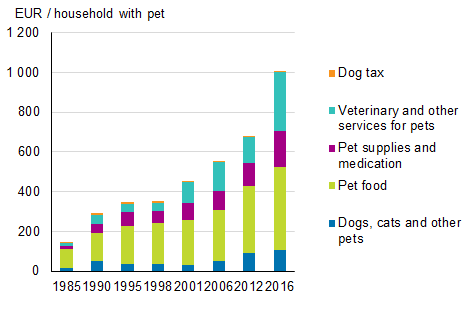
Average expenditure on pets by households owning pets at current prices (1985–2016)

Data on pet insurances have been collected only in the data collections in 2012 and 2016, and pet insurances have not been added to the figure in order to preserve the comparability of data. Source: Household Budget Survey 1985–2016
The figure above shows the average total expenditure on pets by households owning pets. A household is defined as a household owning pets if the members of the household have spent money on purchasing a pet, services, food, supplies or medication for a pet or on dog tax. The Household Budget Survey has inquired about the number of household pets since 2012.
In 2016, households with pets used EUR 1,000, on average, on products and services for pets and for purchasing new pets. Expenditure on pets grew from 2012 to 2016 by a total of EUR 330. The growth was strongest in expenditure on veterinary services and other pet services, on which households used around EUR 130, on average, in 2012 and around EUR 300 in 2016. The largest share of expenditure on pets has been used on pet food from 1985 to 2016.
Almost three out of four households owned a car in 2016
According to the data of the Household Budget Survey, households owned 2.8 million cars in 2016. Around 73 per cent of all households, i.e. around 1.9 million households owned at least one car, while the share was 74 per cent in 2012. Twenty per cent of households had two cars and five per cent had three or more cars. Cars include passenger cars, vans and caravans.
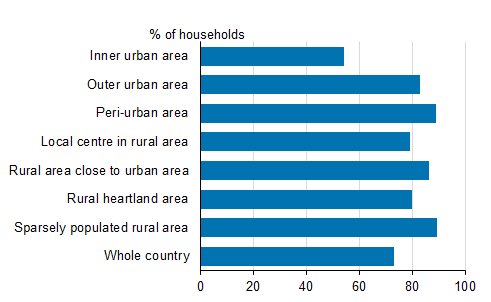
Share of households with a car by area type (2016)

Source: Household Budget Survey 2016
However, owning a car varies by area. In centre-like areas, the share of households with cars, i.e. those owning at least one car, was lower than in less populated areas. The figure presents the share of households with a car according to the urban-rural classification. The share of households with a car was over one half in all areas. In inner urban areas, fewer cars were owned than in other areas – 54 per cent of households owned a car. Elsewhere, the share of those with a car varied between around 80 and 90 per cent. The lower share of households with a car in inner urban areas is likely explained by densely constructed areas, short distances and public transport.
In relative terms, most households with a car lived in peri-urban areas and sparsely populated rural areas. In outer urban areas, local centres in rural areas and rural heartland areas there were approximately as many households with a car.
Six per cent of those who flew compensated their emissions in 2016
According to the 2016 Household Budget Survey, six per cent of persons who flew on leisure trips had paid the carbon offset for their flights. Fourteen per cent of households used charged music streaming services and 39 per cent used charged TV entertainment services. Around one per cent of households had a panic alarm phone with a monthly fee. More than 90 per cent of them were used by households of persons aged 64 or over.
Around three per cent of households had an alarm system with a monthly fee. Seventy-nine per cent of the households with an alarm system lived in detached houses. Twenty per cent of households had dwelling-specific water measuring in 2016. Around one half of households living in terraced houses had one in use, while one fourth of those living in blocks of flats used it.
The next Household Budget Survey is due in 2022.
Source: Households' consumption 2016, Statistics Finland
Inquiries: Tuomas Parikka 029 551 3276, Usva Topo 029 551 3036
Director in charge: Jari Tarkoma
Publication in pdf-format (180.8 kB)
- Tables
-
Tables in databases
Pick the data you need into tables, view the data as graphs, or download the data for your use.
Updated 20.4.2020
Official Statistics of Finland (OSF):
Households' consumption [e-publication].
ISSN=2323-3028. 2016. Helsinki: Statistics Finland [referred: 4.2.2026].
Access method: http://stat.fi/til/ktutk/2016/ktutk_2016_2020-04-20_tie_001_en.html

