This set of statistics has been discontinued.
New data are no longer produced from the statistics.
Published: 30 September 2010
Domestic banks’ net income from financial operations contracted and commission income grew in the second quarter
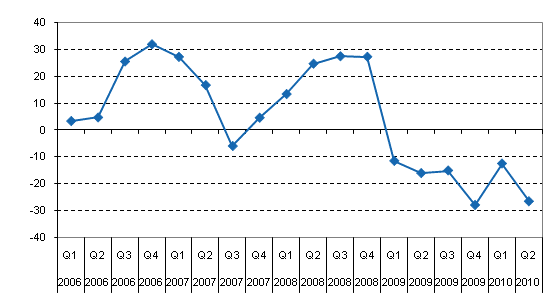
In the second quarter of 2010, domestic banks’ net income from financial operations amounted to EUR 618 million. Their net income from financial operations contracted by 27 per cent from the respective quarter of the year before. The year-on-year contraction of their net income from financial operations has now continued for eighteen months. These data derive from Statistics Finland’s Financial statement statistics on credit institutions.
Year-on-year change in net income from financial operations of domestic banks by quarter, %

The fallen net income from financial operations is particularly explained by the narrowing of the difference in the interest rate between the loan and deposit stocks, i.e. interest margin, which continued through the second quarter.
Commission income rose in the second quarter. Its year-on-year growth amounted to 6 per cent. By contrast, net gains from securities and foreign currency transactions diminished by 34 per cent when compared with the second quarter of 2009.
Recorded impairment losses on loans and other commitments amounted to EUR 119 million in the second quarter. This is 7 per cent less than in the previous quarter and 42 per cent less than twelve months earlier. Impairment losses have been decreasing since the third quarter of 2009 when they totalled EUR 233. Nevertheless their present level is still higher than it was prior to 2008.
The net operating profit of domestic banks amounted to EUR 378 million in the second quarter, which is 18 per cent less than one year earlier. The aggregate value of the balance sheets was EUR 401 billion. The balance sheets grew by 21 per cent year-on-year. A significant proportion of the balance sheet growth came from changed values of derivative instruments on the side of both assets and liabilities. The share of own equity in the total of the balance sheets was 5 per cent.
Source: Credit institutions' annual accounts, Statistics Finland
Inquiries: Marja Keltanen (09) 1734 3328, Paula Paavilainen (09) 1734 3539, rahoitusmarkkinat@stat.fi
Director in charge: Ari Tyrkkö
- Tables
-
Tables in databases
Pick the data you need into tables, view the data as graphs, or download the data for your use.
Updated 30.9.2010
Official Statistics of Finland (OSF):
Financial statement statistics on credit institutions [e-publication].
ISSN=2342-5180. 2nd quarter 2010. Helsinki: Statistics Finland [referred: 25.4.2024].
Access method: http://www.stat.fi/til/llai/2010/02/llai_2010_02_2010-09-30_tie_001_en.html

