

Published: 17 May 2017
Immigration rose to a new record level in 2016
According to Statistics Finland, 34,905 persons moved to Finland in 2016, which was 21 per cent more than one year earlier. The number of immigrants exceeded the record of 2013 by nearly 3,000 immigrants. Emigration also increased from the previous year, but clearly less than immigration. A total of 18,082 persons moved abroad from Finland, 11 per cent more than in the year before. The migration gain for Finland grew to 16,823 persons from the previous year's 12,441.
Migration between Finland and other countries 1993–2016
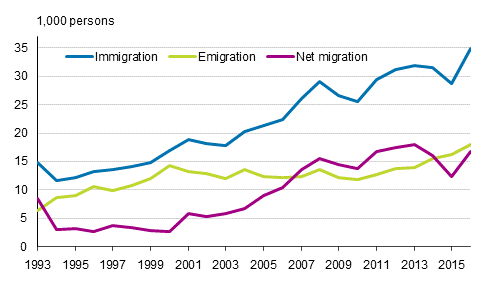
Of immigrants, 27,274 or 78 per cent were foreign citizens in 2016. Fifty-nine per cent or 10,603 of emigrants were Finnish citizens. Finland's migration gain from foreign citizens amounted to 19,795 persons, but Finnish citizens generated a migration loss of 2,972 persons.
Immigration gain from immigrants from outside the EU
Finland's migration gain consisted almost completely of immigrants from outside the EU in 2016. Immigration from other than EU countries increased considerably from the year before, while emigration to countries outside the EU was much lower. Net immigration from countries outside the EU grew to 15,716 from the previous year's 10,247.
Immigration gain was the largest from Iraq, 3,069 immigrants, second largest from Russia, 2,087 immigrants, and third largest from Afganistan, 1,097 immigrants.
Immigration from EU countries to Finland remained at the same level compared with the previous year, down by just 182 persons to 12,913. Instead, emigration to EU countries has now been growing for six years in succession. Last year, 11,806 persons emigrated from Finland to other EU countries. This was 905 persons more than one year previously. As a result of the development described above, Finland’s migration gain from EU countries was nearly one half lower than in the year before, 1,107 persons.
More intermunicipal migrations, fewer migrations within municipalities
In 2016, the number of intermunicipal migrations totalled 282,257, which was 1,986 more than in 2015. The number of migrations between regions was 133,230, with a growth of just 686, having been 7,000 in the year before. Migrations between regions numbered 149,027, which was 1,300 more than one year earlier. In 2016, the number of intramunicipal migrations was 590,830, which was 22,644 lower than in 2015.
When looking at migration inside the country, the region of Uusimaa had the largest and the region of Pirkanmaa the second largest migration gain. In Uusimaa, the gain amounted to 6,700 and in Pirkanmaa to 1,876 persons. Migration gain relative to the population in Mainland Finland was largest in Uusimaa, where the migration gain was four per mil. The relative migration gain in Pirkanmaa was slightly lower than in Uusimaa.
The region having suffered the largest population loss in migration inside the country was North Ostrobothnia, 1,403 persons. Kainuu had the largest relative migration loss of six per mil. The relative migration loss was the second largest in Ostrobothnia. In intramunicipal migration 13 regions suffered from migration loss.
Migration gain for regions from immigration
All regions received migration gain from international migration. Taking that into account, the number of regions with migration loss falls somewhat. The sum of net immigration and net emigration was negative in ten regions. In Mainland Finland, net regional immigration was highest in Kymenlaakso and lowest in South Ostrobothnia in relative terms.
Internal migration and in- and out-migration 2005–2016
| Year | Intermunicipal | Intramunicipal | Immigration | Emigration | Net migration |
| 2005 | 267 939 | 624 030 | 21 355 | 12 369 | 8 986 |
| 2006 | 265 469 | 600 097 | 22 451 | 12 107 | 10 344 |
| 2007 | 272 285 | 595 985 | 26 029 | 12 443 | 13 586 |
| 2008 | 262 454 | 567 619 | 29 114 | 13 657 | 15 457 |
| 2009 | 257 595 | 577 668 | 26 699 | 12 151 | 14 548 |
| 2010 | 264 362 | 575 323 | 25 636 | 11 905 | 13 731 |
| 2011 | 274 896 | 600 781 | 29 481 | 12 660 | 16 821 |
| 2012 | 274 650 | 595 163 | 31 278 | 13 845 | 17 433 |
| 2013 | 265 844 | 577 960 | 31 941 | 13 893 | 18 048 |
| 2014 | 267 799 | 571 775 | 31 507 | 15 486 | 16 021 |
| 2015 | 280 271 | 613 474 | 28 746 | 16 305 | 12 441 |
| 2016 | 282 257 | 590 830 | 34 905 | 18 082 | 16 823 |
Source: Migration 2016. Statistics Finland
Inquiries: Timo Nikander 029 551 3250, Matti Saari 029 551 3401, info@stat.fi
Director in charge: Jari Tarkoma
Publication in pdf-format (282.8 kB)
- Tables
-
Tables in databases
Pick the data you need into tables, view the data as graphs, or download the data for your use.
Appendix tables
- Figures
- Quality descriptions
-
- Quality description, migration 2016 (17.5.2017)
Updated 17.5.2017
Official Statistics of Finland (OSF):
Migration [e-publication].
ISSN=1797-6782. 2016. Helsinki: Statistics Finland [referred: 15.7.2026].
Access method: http://stat.fi/til/muutl/2016/muutl_2016_2017-05-17_tie_001_en.html