

1.Downturn in Finnish economy easing off, secondary production and services still at lower levels than one year ago
In the second quarter, the volume of Finland’s gross domestic product grew by 0.2 per cent from the previous quarter. Adjusted for working days, gross domestic product was 1.2 per cent down on the second quarter of 2012. Calculated at current prices, gross domestic product adjusted for working days was 0.9 per cent higher than one year ago.
Figure 1. Volume change of GDP from the previous quarter (seasonally adjusted, per cent)
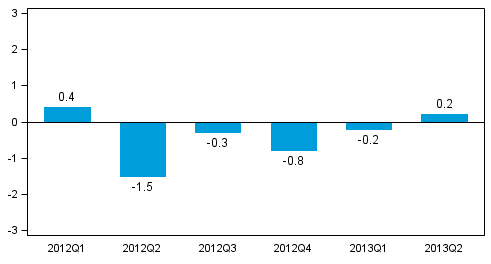
The seasonally adjusted volume of gross domestic product made a slight upturn after four successive quarters of a decline. The downturn in the economy seems to have eased off in the second quarter but the seasonally adjusted change in the volume from the previous quarter was still very close to zero.
The seasonal adjustment model for the volume of gross domestic product has been updated. The previously used working-day adjustment was no longer statistically significant so it was replaced with adjustment for the Easter effect, which is statistically significant. According to the estimated seasonal adjustment model, Easter decreases the level of the original series of GDP for the quarter in which it occurs and also the change percentages calculated based on it. By taking Easter into consideration in seasonally adjusted, working-day adjusted and trend series, the idea is to improve comparability at different points in times. According to the working-day adjusted series which are adjusted for the Easter effect, GDP contracted by 1.2 per cent in the second quarter from one year ago. Without adjustment for the Easter effect, this annual change in the second quarter would have amounted to -0.7 per cent.
According to preliminary data compiled by Eurostat, GDP in the EU-27 area grew by 0.3 per cent in the second quarter of 2013 compared to the previous quarter.
1.1. Production
The volume of total value added generated by all industries grew by 0.4 per cent from the previous quarter but diminished by 0.9 per cent from twelve months back.
Figure 2. Changes in the volume of value added by industry, 2013Q2 compared to one year ago (working day adjusted, per cent)
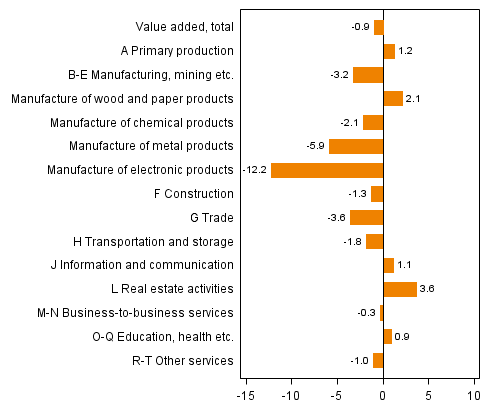
Figure 3. Changes in the volume of value added by industry, 2013Q2 compared to the previous quarter (seasonally adjusted, per cent)
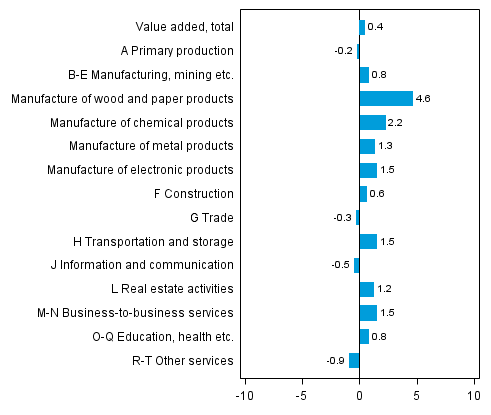
In primary production, that is, agriculture, forestry and fishing, the volume of value added was 0.2 per cent lower in the second quarter than in the previous quarter and 1.2 per cent higher than one year earlier.
Manufacturing output made a slight upturn in April to June. Value added in manufacturing (industries B-E) was 0.8 per cent up on the previous quarter but 3.2 per cent down on the respective quarter twelve months back. Output of all manufacturing industries C grew from the previous quarter. However, manufacturing (C) was still 4.1 per cent lower than one year before.
Output in construction increased by 0.6 per cent in April to June from the previous quarter but decreased by 1.3 per cent year-on-year.
In service industries, value added increased by 0.1 per cent from the previous quarter but decreased by 0.4 per cent year-on-year. Value added in private services decreased but value added of public services grew by one per cent from one year ago. The fact that Yleisradio Oy (Finnish Broadcasting Company) moved from the private sector to the public sector is visible both in the value added of public services and in public consumption expenditure.
Value added in trade was 0.3 per cent lower than in the previous quarter and 3.6 per cent lower than in the second quarter of 2012.
1.2. Imports, exports, consumption and investments
In the second quarter of 2013, total demand grew by 0.3 per cent from the previous quarter but contracted by 1.2 per cent from twelve months back. Compared to one year ago, consumption increased demand in the national economy but decreased exports and investments lowered it.
Figure 4. Changes in the volume of main supply and expenditure components, 2013Q2 compared to one year ago (working day adjusted, per cent)
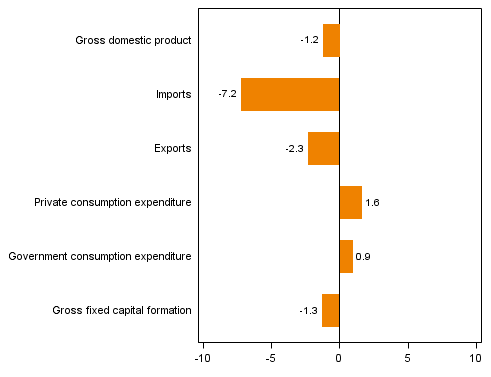
Figure 5. Changes in the volume of main supply and expenditure components, 2013Q2 compared to the previous quarter (seasonally adjusted, per cent)
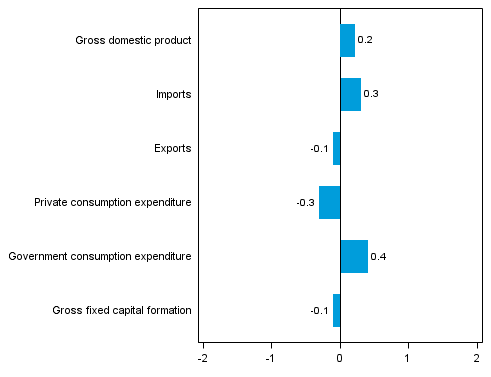
The change in the volume of exports from the previous quarter has remained close to zero throughout the first half of the year. Compared to last year, the volume of exports was 2.3 per cent lower in April to June. Exports of goods decreased by 2.2 per cent and those of services by 2.5 per cent year-on-year. In the assessment of exports, and in particular goods export, it is best to use original or working day adjusted data. Irregular seasonal variation in Finnish goods exports makes it more difficult to carry out seasonal adjustment, which means that seasonally adjusted data and change percentages calculated based on them are hard to interpret.
Imports increased by 0.3 per cent from the previous quarter but decreased by 7.2 per cent year-on-year. Imports of goods decreased by 5.9 per cent and those of services by 10.2 per cent year-on-year.
In the second quarter, the volume of private consumption contracted by 0.3 per cent from the previous quarter but grew by 1.6 per cent from twelve months back.
Gross fixed capital formation fell by 0.1 per cent from the previous quarter and by 1.3 per cent year-on-year. Construction investments grew by 0.4 per cent from the previous quarter but fell by 1.5 per cent from one year back. The volume of investments in machinery, equipment and transport equipment decreased by 3.7 per cent from the previous quarter but grew by 5.3 per cent year-on-year.
1.3. Employment, wages and salaries and national income
In the second quarter, the number of employed persons grew by 0.1 per cent from the previous quarter. The number of employed persons was 0.7 per cent lower than one year earlier. The number of hours worked in the national economy decreased by 0.2 per cent from the previous quarter and by 1.3 per cent from one year back.
According to Statistics Finland’s Labour Force Survey, the unemployment rate for the April to June period was 9.1 per cent. In the corresponding period of last year it stood at 8.6 per cent.
In the April to June period, the nominal wages and salaries bill of the national economy grew by 0.9 per cent from the previous quarter and by 1.7 per cent year-on-year. Social contributions paid by employers grew by 1.0 per cent from the previous quarter and by 1.4 per cent year-on-year.
The operating surplus (net), which roughly corresponds with business profit in business bookkeeping, grew from the previous quarter by 1.2 per cent at current prices but was 1.6 per cent lower than one year ago. Gross national income calculated at current prices was 1.5 per cent higher than one year previously.
1.4. The available data
These preliminary data on the first quarter of 2013 are based on the source information on economic development that had become available by 28 August 2013.
The annual level data for 1990 to 2012 correspond with the National Accounts data released on 11 July 2013, except for those on the rest of the world sector (imports, exports, primary income from/to the rest of the world), which may have become revised. Data on the third quarter of 2013 will be released on 5 December 2013, when the data for previous quarters will also be revised. A flash estimate on GDP development for July to September will be released in connection with the Trend Indicator of Output on 14 November 2013.
Due to the benchmarking and seasonal adjustment methods, quarterly data in the entire time series may become slightly revised in connection with each release. However, the largest revisions take place during the two to three years following the release on a quarter, because final annual accounts data are published at a lag of around two years from the end of the statistical reference year. Seasonally adjusted and trend time series always become revised against new observations irrespective of whether the original time series becomes revised or not.
The quality description can be accessed at (in Finnish): http://tilastokeskus.fi/til/ntp/laa.html
Methodological description of Quarterly National Accounts: http://tilastokeskus.fi/til/ntp/men_en.html
Quarterly National Accounts tables package is available free: http://tilastokeskus.fi/til/ntp/tup_en.html
Source: National Accounts 2013, 2nd quarter. Statistics Finland
Inquiries: Samu Hakala 09 1734 3756, Veli-Pekka Karvinen 09 1734 2667, kansantalous.suhdanteet@stat.fi
Director in charge: Leena Storg�rds
Updated 5.9.2013
Official Statistics of Finland (OSF):
Quarterly national accounts [e-publication].
ISSN=1797-9765. 2nd quarter 2013,
1.Downturn in Finnish economy easing off, secondary production and services still at lower levels than one year ago
. Helsinki: Statistics Finland [referred: 12.4.2026].
Access method: http://stat.fi/til/ntp/2013/02/ntp_2013_02_2013-09-05_kat_001_en.html