

1. Married couple without children is still the commonest family type in Finland
Families are classified according to whether the spouses are married, cohabiting or in a registered partnership and whether they have children. In addition to this, there are one-parent families. In this classification, no limit is set as to the age of a child. Families with children, defined as families having at least one child under the age of 18 living at home, are discussed in Chapter 3. Where families with underage children are concerned, parents are also referred to as supporters. In the following examination, one-parent families are not only single-supporter families, as a person having the status of a child living with his/her mother or father may be of any age. In these statistics, the oldest person with the status of a child is 78 years old.
At the end of 2010, there were 1,455,000 families in Finland. Their number grew by 4,600 from the year before. The increase was 1,500 smaller than in the previous year.
Altogether 76 per cent of the population in Finland belong to a family. The proportion decreased by 0.3 percentage points from the previous year. The rate of its decrease has remained at this level since the beginning of the 1990s. The proportion of the family population was at its highest in the 1960s and 1970s, when 87 per cent of the population belonged to a family. The number of persons belonging to a family rose by 5,700 during 2010. Total population increased by 23,800 persons. At the end of 2010, the average size of a family in Finland was 2.79 persons.
Table 1. Family population and average size of family in 1950–2010
| Year | Families total | Family population | Population | Proportion of family population, % | Average size of family |
| 1950 | 930 572 | 3 457 474 | 4 029 803 | 85,8 | 3,7 |
| 1960 | 1 036 270 | 3 855 037 | 4 446 222 | 86,7 | 3,7 |
| 1970 | 1 153 878 | 3 986 005 | 4 598 336 | 86,7 | 3,5 |
| 1980 | 1 278 102 | 4 023 091 | 4 787 778 | 84,0 | 3,1 |
| 1990 | 1 365 341 | 4 101 922 | 4 998 478 | 82,1 | 3,0 |
| 2000 | 1 401 963 | 4 053 850 | 5 181 115 | 78,2 | 2,9 |
| 2005 | 1 426 002 | 4 037 753 | 5 255 580 | 76,8 | 2,8 |
| 2006 | 1 431 376 | 4 039 944 | 5 276 955 | 76,6 | 2,8 |
| 2007 | 1 437 709 | 4 045 561 | 5 300 484 | 76,3 | 2,8 |
| 2008 | 1 444 386 | 4 051 662 | 5 326 314 | 76,1 | 2,8 |
| 2009 | 1 450 488 | 4 059 511 | 5 351 427 | 75,9 | 2,8 |
| 2010 | 1 455 073 | 4 065 168 | 5 375 276 | 75,6 | 2,8 |
The commonest family type in Finland is still a married couple without children, which made up 35 per cent of all families in 2010. As recently as in 2004, the most common family type was married couple with children of some age living at home. In 2010, 31 per cent of all families were families of a married couple with children. However, the number of such families has been on the decline for a long time, whereas the number of married couples without children has been rising. The yearly changes in this have been continually diminishing. For example, the number of married couples living with their children decreased by 2,500 from the previous year, whereas from 2005 to 2006 the number decreased by 6,700. Because the yearly changes are small, it is difficult to clearly pinpoint the reasons for the decreases and increases in the numbers of the different family types.
The number and proportion of cohabiting couples among families is also growing. However, cohabiting couples without children make up only 14 per cent of all families. Today, eight per cent of all families are cohabiting couples with children. The number has been growing slowly in recent years.
The number of “mother and children” families has declined now for the eleventh consecutive year. “Father and children” families are still rare; they number only two in one hundred. Their relative proportion has hardly changed at all in the past few years.
Table 2. Families by type in 1950–2010
| Year | Total | Married couple without children | Married couple with children | Cohabiting couple with children | Cohabiting couple without children | Mother and children | Father and children | Registered male couple 1) | Registered female couple 1) |
| 1950 | 930 572 | 176 650 | 593 763 | .. | .. | 137 803 | 22 356 | .. | .. |
| 1960 | 1 036 270 | 207 897 | 678 822 | .. | .. | 129 706 | 19 845 | .. | .. |
| 1970 2) | 1 153 878 | 260 562 | 722 001 | 6 800 | 19 100 | 126 394 | 19 021 | .. | .. |
| 1980 3) | 1 278 102 | 302 818 | 711 226 | 36 200 | 65 900 | 140 725 | 21 233 | .. | .. |
| 1990 | 1 365 341 | 364 452 | 640 062 | 65 896 | 123 471 | 147 297 | 24 161 | .. | .. |
| 2000 | 1 401 963 | 436 019 | 514 868 | 102 581 | 160 132 | 159 432 | 28 931 | .. | .. |
| 2001 | 1 407 759 | 446 404 | 501 981 | 105 399 | 166 601 | 158 440 | 28 934 | .. | .. |
| 2002 | 1 411 947 | 454 977 | 492 524 | 107 443 | 170 368 | 157 143 | 29 093 | 207 | 192 |
| 2003 | 1 415 104 | 462 561 | 483 140 | 109 672 | 174 144 | 156 235 | 29 352 | 271 | 275 |
| 2004 | 1 420 781 | 471 962 | 475 705 | 111 294 | 177 095 | 154 851 | 29 192 | 325 | 357 |
| 2005 | 1 426 002 | 481 209 | 468 266 | 112 847 | 180 590 | 153 024 | 29 238 | 398 | 430 |
| 2006 | 1 431 376 | 488 880 | 461 569 | 114 671 | 184 732 | 151 475 | 29 101 | 455 | 493 |
| 2007 | 1 437 709 | 496 814 | 456 235 | 115 860 | 188 172 | 150 251 | 29 288 | 527 | 562 |
| 2008 | 1 444 386 | 504 728 | 452 180 | 115 966 | 191 177 | 149 631 | 29 460 | 579 | 665 |
| 2009 | 1 450 488 | 509 916 | 448 897 | 116 797 | 193 894 | 149 823 | 29 765 | 625 | 771 |
| 2010 | 1 455 073 | 513 889 | 446 433 | 117 254 | 195 967 | 149 651 | 30 278 | 706 | 895 |
| % | |||||||||
| 1950 | 100,0 | 19,0 | 63,8 | .. | .. | 14,8 | 2,4 | .. | .. |
| 1960 | 100,0 | 20,1 | 65,5 | .. | .. | 12,5 | 1,9 | .. | .. |
| 1970 2) | 100,0 | 22,6 | 62,6 | 0,6 | 1,7 | 11,0 | 1,6 | .. | .. |
| 1980 3) | 100,0 | 23,7 | 55,6 | 2,8 | 5,2 | 11,0 | 1,7 | .. | .. |
| 1990 | 100,0 | 26,7 | 46,9 | 4,8 | 9,0 | 10,8 | 1,8 | .. | .. |
| 2000 | 100,0 | 31,1 | 36,7 | 7,3 | 11,4 | 11,4 | 2,1 | .. | .. |
| 2001 | 100,0 | 31,7 | 35,7 | 7,5 | 11,8 | 11,3 | 2,1 | .. | .. |
| 2002 | 100,0 | 32,2 | 34,9 | 7,6 | 12,1 | 11,1 | 2,1 | 0,0 | 0,0 |
| 2003 | 100,0 | 32,7 | 34,1 | 7,8 | 12,3 | 11,0 | 2,1 | 0,0 | 0,0 |
| 2004 | 100,0 | 33,2 | 33,5 | 7,8 | 12,5 | 10,9 | 2,1 | 0,0 | 0,0 |
| 2005 | 100,0 | 33,7 | 32,8 | 7,9 | 12,7 | 10,7 | 2,1 | 0,0 | 0,0 |
| 2006 | 100,0 | 34,2 | 32,2 | 8,0 | 12,9 | 10,6 | 2,0 | 0,0 | 0,0 |
| 2007 | 100,0 | 34,6 | 31,7 | 8,1 | 13,1 | 10,5 | 2,0 | 0,0 | 0,0 |
| 2008 | 100,0 | 34,9 | 31,3 | 8,0 | 13,2 | 10,4 | 2,0 | 0,0 | 0,0 |
| 2009 | 100,0 | 35,2 | 30,9 | 8,1 | 13,4 | 10,3 | 2,1 | 0,0 | 0,1 |
| 2010 | 100,0 | 35,3 | 30,7 | 8,1 | 13,5 | 10,3 | 2,1 | 0,0 | 0,1 |
2) The breakdown of the census by type of family has been revised on the basis of interview surveys. (Aromaa, Cantell & Jaakkola: Avoliitto (Consensual Union), Research Institute of Legal Policy 49, Helsinki 1981).
3) The breakdown of the census by type of family has been revised on the basis of the 1981 register-based material on families and cohabiting couples.
1.1 Commonest family type for young women with family is cohabiting couple without children
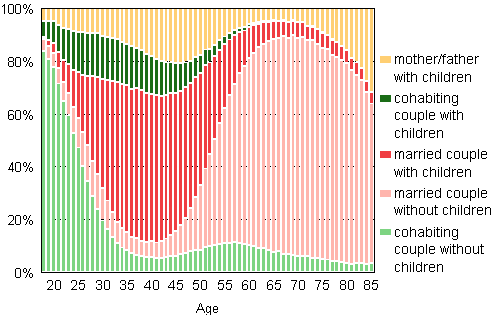
Women's family type varies by age. The most typical family type for young women aged under 28 with family is cohabiting couple without children. The commonest family type for 28-year-old women is already “married couple with children”. “Married couple without children” only becomes the most typical family type for women once they have turned 52. The families of the oldest women (at least 89 years of age) tend to include a child rather than a husband. Only nine per cent of women of this age still belong to the family population. In the light of family statistics, old age is rather different for men. For example, 46 per cent of the men aged 89 belong to families. Then the family is typically a married couple without children living with them.
Figure 1A. Families by type and age of wife/mother in 2010 (families with father and children by age of father)
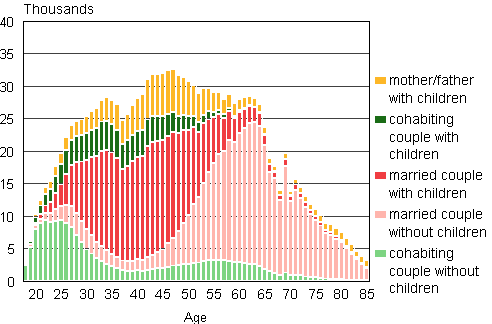
Figure 1B. Families by type and age of wife/mother in 2010 (families with father and children by age of father), relative breakdown
1.2 Number of registered partnerships is still low
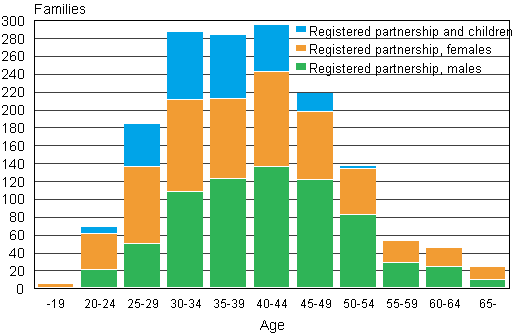
At the end of 2010, 706 male couples and 895 female couples lived in a registered partnership, which is a total of 205 couples more than in 2009. In most of the tables in this publication these families are included in married couples. In some of the tables on the whole country these families form a group of their own. For reasons of privacy protection, this information can be given by municipality only if the couples number at least five. Figure 2 shows the age distribution of registered male and female couples according to the younger partner. It shows that male couples are older than female couples. In the other figures registered couples are given among married couples. There are still so few of them that they would not be distinguishable as a separate group.
Figure 2. Registered partnerships by age of younger partner in 2010
1.3 Women aged under 40 without children are more often cohabiting than married
Cohabitation is the form of family life chosen by young couples without children. Up to the age of 40, women without children tend to prefer cohabitation to marriage. Where mothers are concerned, the only ones to favour cohabitation over marriage are in the small group of mothers aged under 25. The majority of mothers older than this living with their spouses are married. The older the woman, the more likely she is to be married to her spouse.
Married couples account for 66 per cent of all families and for 75 per cent of all married and cohabiting couples. Cohabiting couples make up 22 per cent of all families. Of the families consisting of spouses living together, 25 per cent are cohabiting couples.
In 82 per cent of all married couples both spouses are married for the first time. Thus the conventional form of family can still be considered to prevail in Finland. In 67 per cent of cohabiting couples neither spouse had been previously married. Hence, on the average, there are clearly more couples where one of the spouses has been married before among cohabiting couples than among married couples. In 84 per cent of the registered male couples neither partner has been married before, the figure for female couples is 75 per cent.
1.4 More cohabiting women than cohabiting men are widowed
In the past, a person's marital status revealed quite a lot about his or her family. Today, hardly any conclusions can be drawn from a person’s marital status. In the Nordic Countries, marital status is losing meaning as a demographic variable.
Seventy-four per cent of the women and 75 per cent of the men living with a cohabiting partner without children are unmarried. More cohabiting women than cohabiting men are widowed.
Slightly more of the men than of the women living with children and a cohabiting partner are unmarried. Correspondingly, slightly fewer of the men than of the women are divorced. The probable explanation to this is reconstituted families where a new partner has moved in to live with a divorced mother. More cohabiting mothers than cohabiting fathers are also widowed.
Table 3. Marital status of the man/woman/father/mother in a cohabiting partnership and in a one-parent family in 2010
| Marital status | Type of family | |||||||
| Cohabiting man no children | Cohabiting woman no children | Cohabiting man with children | Cohabiting woman with children | Father and children | Father and children aged under 18 | Mother and children | Mother and children aged under 18 | |
| Unmarried | 75,0 | 73,9 | 78,3 | 77,3 | 18,1 | 26,7 | 31,4 | 40,8 |
| Married | 0,8 | 0,7 | 0,4 | 0,5 | 13,0 | 14,6 | 9,8 | 12,0 |
| Divorced | 22,4 | 21,3 | 20,7 | 20,9 | 51,6 | 53,1 | 42,8 | 44,2 |
| Widowed | 1,8 | 4,2 | 0,6 | 1,3 | 17,4 | 5,7 | 16,0 | 3,0 |
| Total | 100,0 | 100,0 | 100,0 | 100,0 | 100,0 | 100,0 | 100,0 | 100,0 |
| N | 195 929 | 195 922 | 117 248 | 117 237 | 30 265 | 15 833 | 149 543 | 101 863 |
Mothers and fathers in one-parent families differ in their marital status. More than one-half of the fathers but clearly fewer of the mothers are divorced. Altogether, 31 per cent of the mothers but only 17 per cent of the fathers are unmarried. However, it should be noted here that no limit is set on the age of a child, i.e. we are not referring to single supporters. The child of a one-parent family can be of any age, meaning that families formed by old widowed mothers and their grown-up children, for example, are included.
Table 3 also contains columns for one-parent families, that is, fathers and mothers whose children are underage. Their marital status structure differs most clearly from the group of all one-parent families. They include fewer widowed persons and more persons representing other marital status groups. It is noteworthy that almost twice as many single fathers as single mothers are widowed, although fewer fathers than mothers become widowed. In divorces, children usually stay with their mother, but there is no choice in the case of death. Already as many as 41 per cent of single mothers are unmarried; some having been single parents from the outset but a larger number as the result of a divorce.
Source: Population and Cause of Death Statistics, Statistics Finland
Inquiries: Marjut Pietiläinen (09) 1734 2798, Timo Nikander (09) 1734 3250, vaesto.tilasto@stat.fi
Director in charge: Jari Tarkoma
Updated 30.11.2011
Official Statistics of Finland (OSF):
Families [e-publication].
ISSN=1798-3231. Annual Review 2010,
1. Married couple without children is still the commonest family type in Finland
. Helsinki: Statistics Finland [referred: 11.6.2026].
Access method: http://stat.fi/til/perh/2010/02/perh_2010_02_2011-11-30_kat_001_en.html