

Households’ financial assets decreased strongly in 2008
Holding losses resulting from decreases in the value of security prices pushed the value of households’ financial assets to a steep decline in 2008. The value of households’ financial assets fell by a total of EUR 14 billion. At the same time the flow from mutual fund shares to deposits which began in 2007 gained strength.
In 2008 households’ financial assets were influenced by holding losses amounting to a total of EUR 19 billion. Direct investments in shares caused close on EUR 11 billion and mutual fund investments nearly EUR 5 billion of losses. Unit-linked life insurance and pension insurance claims also caused losses amounting to nearly EUR 3 billion. Furthermore, households’ financial position weakened indirectly as a result of a decrease in employment pension schemes’ reserve assets. However, households acquired a net of a good EUR 4 billion more financial assets, which is only slightly less than in the year before.
Change in financial assets of households 1996-2008, EUR billion
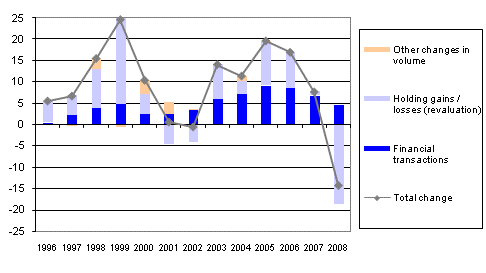
As exceptional insecurity prevailed in stock and other securities markets, the focus of households’ financial assets moved increasingly strongly from securities to deposits. Households moved nearly EUR 8 billion to deposits and at the same time withdrew a good EUR 4 billion from mutual funds. Households’ interest in domestic quoted shares revived after a long interval and quoted share purchases amounted to EUR 1.5 billion in net terms.
All in all households’ financial assets amounted to EUR 187 billion at the end of 2008. Of this amount EUR 71 billion were deposits, EUR 15 billion quoted shares, EUR 40 billion unquoted equity, EUR 33 billion life and pension insurance savings and EUR 9 billion mutual fund shares. The value of other financial assets was EUR 19 billion.
Households’ financial position remained in deficit in 2008. Even though the annual growth in debts slowed down from the year before, indebtedness, i.e. proportion of loans relative to disposable income, rose to 109.8 per cent. Households’ net financial assets, i.e. difference between financial assets and liabilities, shrunk by nearly one-fourth from that in 2007. At the end of 2008 they stood at good EUR 78 billion.
Government sector financial position weakened
Examined through revenue and expenditure, the Finnish general government still showed a strong surplus in 2008. In terms of the sustainability of the public economy, a more important indicator, however, is its financial position. The financial position of the public sector showed a significant turn for the worse as the value of general government financial assets fell by EUR 33 billion in the year. Employment pension schemes’ assets consolidated for future pension payments faced EUR 26 billion of holding losses in 2008. The decrease of central government share holdings by EUR 14 billion turned central government net financial assets negative by EUR 11 billion. General government debt increased slightly in 2008.
The focus of employment pension schemes’ investments moved in 2008 from shares and mutual fund shares to loans and debt securities. Employment pension schemes lent EUR 3.5 billion to non-financial corporations and added good EUR 3 billion to their debt security investments. Unlike in a few previous years, the focus of investment was now in Finland.
Non-financial corporations’ loans increased strongly
The indebtedness of non-financial corporations accelerated in 2008. Acquiring new financing was done nearly entirely by raising new loans, as the market for bonds and commercial paper dried up. The majority of the EUR 33 billion increase in the loan stock came from loans to other non-financial corporations, but credit institutions and employment pension schemes also provided ample loans to non-financial corporations. In short-term financing credits from banks replaced financing with commercial papers. All in all, non-financial corporations increased their short-term bank loans by good EUR 6 billion.
Investments in foreign shares dried up
Finnish investors, especially employment pension schemes, investment funds and households reclaimed their money from foreign shares and mutual funds to the value of EUR 3 billion, whereas in the year before as much as EUR 10 billion of money had been invested in them. However, non-financial corporations continued their direct investments in foreign shares, spending EUR 10 billion on them.
Foreign investors also cut back strongly their holdings of Finnish quoted shares. In all Finnish quoted shares were sold back to domestic investors at a net value of EUR 5 billion. The fall in market quotations to less than one-half from the year before caused the value of foreign share holdings to plummet to EUR 64 billion at the end of the year. The proportion of foreign ownership of the value of Finnish quoted shares also decreased to 59 per cent.
Loan debts of households and non-financial corporations have grown rapidly
Over the past 40 years, indebtedness has been growing rapidly both among households and non-financial corporations. Between the mid-1970s and 1989, households’ indebtedness, that is, their stock of loans relative to their disposable income, more than doubled to 88.5 per cent. Only the recession of the 1990s put an end to the prolonged growth of the loan stock. Households’ loan stock diminished from 1991 up to 1996, after which it turned back to a steep incline at the onset of the 2000s, from where on indebtedness has grown quite rapidly again. In 2008, both non-financial corporations and households had nearly three times more loan debt than ten years earlier. Households’ indebtedness has also risen fast in recent years and was as high as 109.8 per cent in 2008.
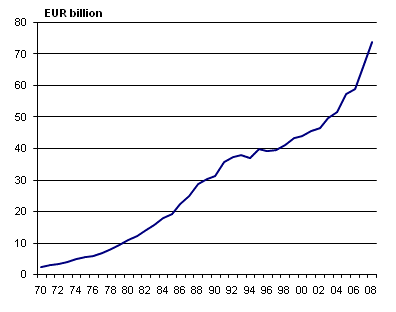
Development of loan debt of households and non-financial corporations in 1970-2008
Besides debts, the financial assets of households have also grown fast. Up to the mid-1990s, the vast majority of households’ financial assets consisted of currency and deposits. In the 1970s, households’ currency assets and deposit receivables were growing at the annual rate of up to over 20 per cent. After the mid-1990s, the share of deposits of households’ financial assets began to decline but then started to grow again in 2007.
Development of currency and deposit receivables of households in 1970-2008
Source: Financial Accounts, Statistics Finland
Inquiries: Matti Okko +358-9-1734 3341, rahoitus.tilinpito@stat.fi
Director in charge: Ari Tyrkk�
Updated 29.1.2010
Official Statistics of Finland (OSF):
Financial accounts [e-publication].
ISSN=1458-8145. 2008,
Households’ financial assets decreased strongly in 2008
. Helsinki: Statistics Finland [referred: 10.6.2026].
Access method: http://stat.fi/til/rtp/2008/rtp_2008_2010-01-29_kat_001_en.html