

1. Households' financial assets grew slightly but indebtedness continued in 2012
Households' financial assets that fell in 2011 due to holding losses grew by EUR 2.5 billion in 2012. As a result of a rise in share prices, households accrued a total of EUR 1.2 billion in holding gains. However, households only acquired financial assets to the net amount of EUR 0.6 billion. Because the growth in financial assets was smaller than that of borrowing, households' net financial assets decreased.
Figure 1. Change in financial assets of households, EUR billion
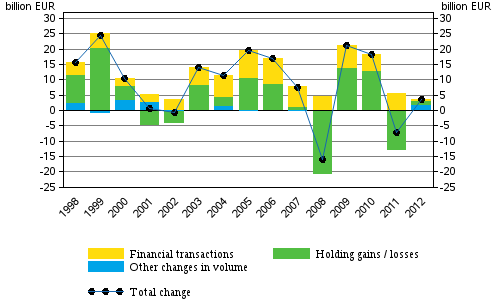
Deposits have typically been the most important investment target for households. In 2012, households favoured cash deposits in particular. Simultaneously, a lot of assets were withdrawn from fixed-term deposits. Investments in mutual fund shares that had decreased heavily in the previous year turned clearly positive in 2012. Households' net investments in quoted shares also increased from the year before.
All in all, households’ financial assets amounted to EUR 220 billion at the end of 2012. Of these, EUR 80 billion were deposits, EUR 46 billion insurance technical reserves, EUR 39 billion unquoted shares and equity, EUR 24 billion quoted shares and EUR 14 billion mutual fund shares. The value of other financial assets held by households was EUR 17 billion. Households' shares in housing companies are not recorded in financial accounts as financial assets.
Households' debts continued to grow. Households' loan debt increased by good EUR 6 billion during 2012, reaching EUR 123 billion at the end of the year. Indebtedness rate, i.e. proportion of loan debts relative to disposable income, rose to 118.2 per cent from the previous year's 115.7 per cent. Because households' debts increased more than their financial assets, households' net financial assets decreased by nearly EUR 4 billion to EUR 88 billion.
1.1. Government sector's balance sheet position improved
Government sector's balance sheet position improved in 2012. At the end of the year, the government sector's net financial assets amounted to EUR 107 billion, which was EUR 4 billion more than one year earlier. The improved balance sheet position is mainly explained by an increase in the financial assets of employment pension schemes that belong to social security funds. While the net financial assets of central government decreased by EUR 8 billion and those of local government by EUR 2 billion, the position of social security funds improved by nearly EUR 15 billion.
Even though central government’s financial assets increased, mainly as a result of an increase in long-term loan receivables, the weakening of the balance sheet position that began in 2008 continued. During 2012, central government's net financial assets contracted from EUR -34 billion to EUR -42 billion. The drop was mainly caused by an increase in the stock of bonds. During the year, gross debt at market prices in the financial accounts of the central government grew by EUR 11 billion.
During 2012, net financial assets of employment pension schemes increased from EUR 133 billion to EUR 147 billion. The growth in employment pension schemes' net financial assets is mainly explained by the increase in the market value of quoted shares and mutual fund shares as a result of the recovery in share prices. During 2012, employment pension schemes accrued a total of EUR 9 billion in holding gains. Similarly, net investments amounted to nearly EUR 4 billion. In 2012, employment pension schemes invested most assets in mutual fund shares and unquoted shares.
1.2. Emissions of quoted shares livened
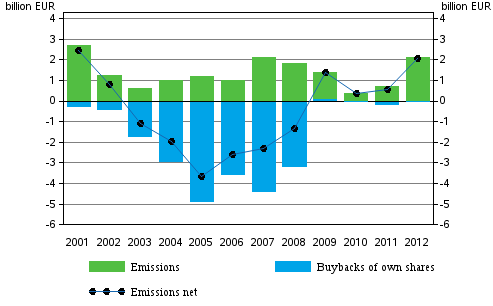
Non-financial corporations were interested in acquiring financing through issuing new equity on the stock market in 2012. Quoted companies issued new shares to the value of EUR 2 billion whereas in the previous year the value of emissions was slightly under EUR one billion. Emissions have been last at this level in 2007. Buybacks of own shares were low just like in the year before. From 2003 to 2008, non-financial corporations amortized their share debt by buying back more of their own shares than issuing them.Figure 2. Changes in emissions of quoted shares by non-financial corporations, EUR billion
Non-financial corporations' debt financing grew during 2012. Simultaneously, the focus of borrowing shifted from loan debts to debt securities. Debt financing refers to the total of loan debts and financing in the form of debt securities. Non-financial corporations' loan debt grew moderately from EUR 169 billion to EUR 172 billion. By contrast, non-financial corporations issued debt securities to the net amount of EUR 9 billion.
1.3. Domestic mutual funds grew
Domestic mutual funds that had contracted in the year before, grew by a total of EUR 21 billion in 2012. Nearly EUR 14 billion of the growth was holding gains from investment portfolios and EUR 7 billion came from net investments. Assets flowed into investment funds especially from abroad, as well as from insurance companies and households. New subscriptions also exceeded redemptions in money market funds.
1.4. Foreign investments to Finland growing
Foreign bonds and mutual fund shares interested Finnish investors slightly more than in the previous year. Finns invested more in quoted foreign shares than in the previous year but the interest was lower than in 2009 to 2010.
In 2012, the total value of the net investments of domestic investors in foreign bonds, shares and funds was EUR 16 billion, while in the year before its was good EUR 8 billion. Even though the trend is growing, the total amount of investments is still less than one-half of the level in 2010.
Clearly less of domestic units' money flowed into foreign deposits and loans than in 2011. The flow decreased from EUR 49 billion in 2011 to nearly EUR 9 billion in 2012. A majority of the drop is explained by a slowdown in the central bank's foreign deposits and a decrease in foreign deposits by deposit banks. Loans to the rest of the world were, like in the year before, granted by deposit banks.
Foreign investors increased their holdings in Finnish quoted shares after a break of several years. In all, quoted shares were sold to foreign investors to the net value of nearly EUR one billion last year. At the end of the year, the value of the ownership of foreign quoted shares was EUR 51 billion. The proportion of foreign ownership of the value of Finnish quoted shares is 43 per cent, just like in the year before. Interest by foreign investors towards Finnish bonds and mutual fund shares has been increasing over the past years and the trend continued also in 2012. Compared to 2008, foreign holdings both in Finnish bonds and mutual fund shares has doubled in value.
1.5. Private sector debt
Private sector debt grew by EUR 18 billion last year, which is EUR 6 billion more than in 2011. The GDP share of the debt grew by 5.6 percentage points to 185.1 per cent. The indicator exceeds the threshold set by the European Commission, which is 160 per cent. A percentage below the threshold was last achieved in 2007.Figure 3. Private sector debt as percentage of GDP
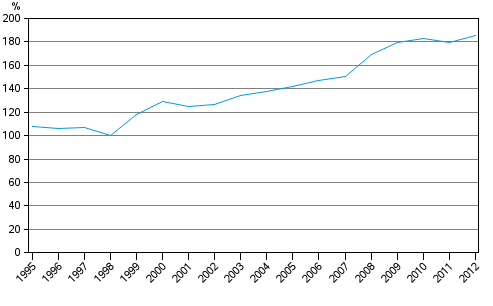
The European Commission has launched a mechanism for the monitoring of macroeconomic imbalance (Macroeconomic Imbalance Procedure), which is based on eleven indicators. One of the indicators is private sector debt as percentage of GDP. Private sector debt comprises the loan debts and debts in the form of debt securities of non-financial corporations, households and non-profit institutions serving households.
Source: Financial Accounts, Statistics Finland
Inquiries: Martti Pykäri 09 1734 3382, rahoitus.tilinpito@stat.fi
Director in charge: Leena Storgĺrds
Updated 11.7.2013
Official Statistics of Finland (OSF):
Financial accounts [e-publication].
ISSN=1458-8145. 2012,
1. Households' financial assets grew slightly but indebtedness continued in 2012
. Helsinki: Statistics Finland [referred: 12.4.2026].
Access method: http://stat.fi/til/rtp/2012/rtp_2012_2013-07-11_kat_001_en.html