

Published: 10 May 2011
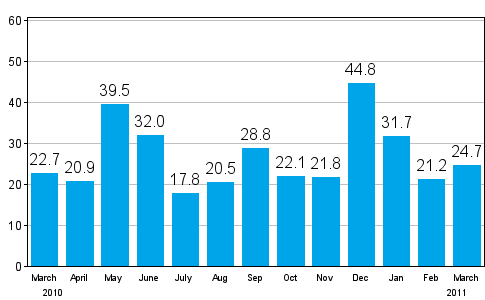
New orders in manufacturing grew by around one-quarter year-on-year in March
According to Statistics Finland, the value of new orders in manufacturing was 24.7 per cent higher in March 2011 than twelve months earlier. In the January to March period, new orders in manufacturing increased by 25.7 per cent year-on-year.
Change in new orders in manufacturing from corresponding month of the previous year (original series), % (TOL 2008)
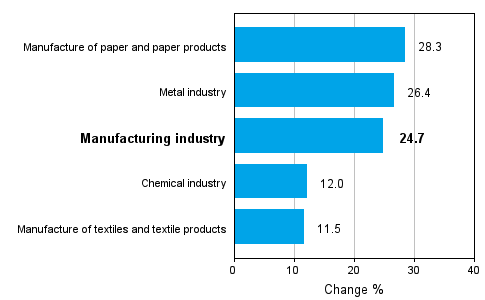
Strong growth of new orders in manufacturing continued through March. As in the preceding months, the value of new orders rose in all the examined main industries. The growth was strongest in the industry of the manufacture of paper and paper board products, where the value of orders was as much as 28.3 per cent up on the year before. Orders went up by 26.4 per cent in the metal industry, by 12.0 per cent in the chemical industry and by 11.5 per cent in the textile industry. Despite the strong growth, the value of new orders in the most important main activity, or the metal industry, was still far from the level in the peak years of 2006 to 2007.
When interpreting these statistics it should be borne in mind that they typically show strong fluctuations by month. Even new orders of substantial value are not examined over extended time periods but for the statistical reference month only. It must also be noted that order cancellations are not taken into account when the value of new orders is calculated.
Change in new orders in manufacturing 03/2010-03/2011 (TOL 2008)
The index of new orders in manufacturing describes development in the value of new orders received by enterprises for commodities and services that are meant to be produced by establishments located in Finland. These statistics are based on non-probability sampling, in which the basic observation unit is an enterprise or a kind-of-activity unit. The sample comprises monthly approximately 400 to 430 enterprises or their kind-of-activity units. Index point figures and annual change percentages are published monthly for five industry categories. The time series start from January 2005 and their base year is 2005 (2005=100). A detailed description of the statistics and the calculation method are included in the quality description on the home page of the statistics.
Source: New orders in manufacturing 2011, March. Statistics Finland
Inquiries: Eetu Toivanen (09) 1734 3331, Kari Rautio (09) 1734 2479, volyymi.indeksi@stat.fi
Director in charge: Hannele Orjala
Publication in pdf-format (248.4 kB)
Updated 10.5.2011
Statistics:
New orders in manufacturing [e-publication].
ISSN=1798-6737. March 2011. Helsinki: Statistics Finland [referred: 11.6.2026].
Access method: http://stat.fi/til/teul/2011/03/teul_2011_03_2011-05-10_tie_001_en.html