

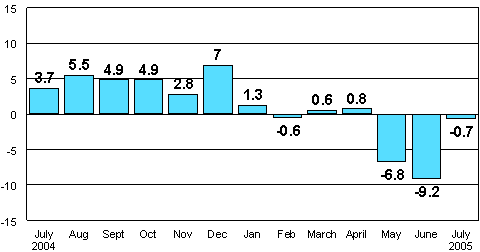
Industrial output fell by 0.7 per cent in July from one year ago
According to Statistics Finland, seasonally adjusted industrial output was 0.7 per cent lower in July 2005 than in July 2004.
Seasonally adjusted change in industrial
output
from corresponding month of previous year, %
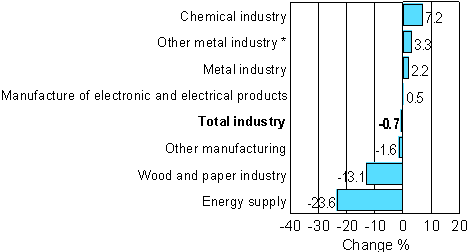
The industrial action in the paper industry, which ended in June, was still reflected in the July output figures. Among the main industries, output fell by most, or by 23.6 per cent, in energy supply. Output in the wood and paper industry went down by 13.1 per cent in July. Output grew by most in the chemical industry, by 7.2 per cent. In the metal industry output rose by 2.2 per cent.
Seasonally adjusted change in industrial output 7/2004-7/2005, %

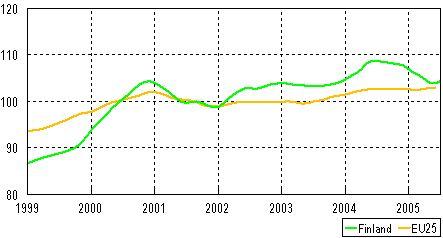
The trend in industrial output showed growth in July. The growth was partly occasioned by the industrial action in the paper industry that ended in June.
Trend in industrial output 1999-2005, (Finland and EU 25), 2000=100
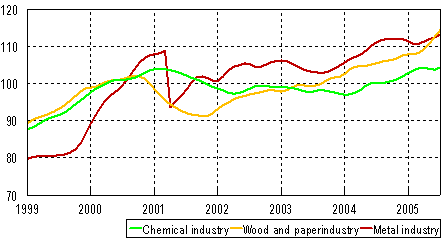
In the metal industry, the trend turned to growth in the summer. In 2003, the metal industry accounted for 48 per cent of the total value added of Finnish industry. In the wood and paper industry, the trend also turned upwards. This was due to the ending of the industrial action in the paper industry in June. The share of the wood and paper industry of the total value added was 16 per cent. The trend in the chemical industry took a slight swing upwards. The chemical industry generated 9 per cent of the total value added.
Trend in industrial output 1999-2005, July
(Chemical industry, wood and paper industry and metal industry),
2000=100
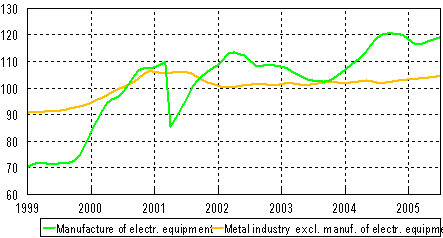
Measured in terms of value added, the manufacture of electrical and electronic products has become Finland's most important industry. Its share of the total value added was 24 per cent in 2003. The trend in the manufacture of electrical and electronic products continued to grow. In the other metal industry, which accounted for 24 per cent of the total value added, output has followed an evenly modest path.
Trend in industrial output 1999-2005, July
(Manufacture of electrical and electronic products and other metal
industry), 2000=100
Last updated 30.8.2005
Official Statistics of Finland (OSF):
Volume index of industrial output [e-publication].
ISSN=1798-9272. July 2005,
Industrial output fell by 0.7 per cent in July from one year ago
. Helsinki: Statistics Finland [referred: 12.6.2026].
Access method: http://stat.fi/til/ttvi/2005/07/ttvi_2005_07_2005-08-30_kat_001_en.html