

Published: 10 May 2013
Industrial output decreased by 0.3 per cent year-on-year in March
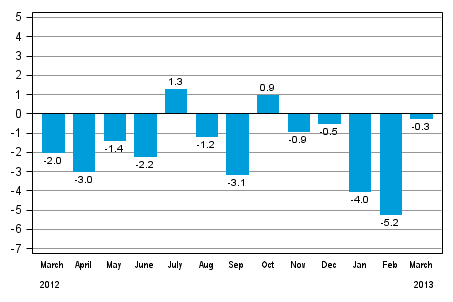
According to Statistics Finland, output of total industries adjusted for working days was 0.3 per cent lower in March 2013 than twelve months earlier. In the first quarter of 2013, industrial output adjusted for working days went down by three per cent from one year ago.
Working day adjusted change in industrial output (BCDE) from corresponding month previous year, %, TOL 2008
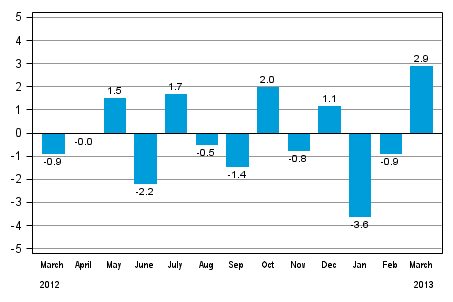
Seasonally adjusted output increased in March by 2.9 per cent from February. In February, seasonally adjusted output was 0.9 per cent lower than in January. In January, output decreased by 3.6 per cent from the previous month.
Seasonally adjusted change in industrial output (BCDE) from previous month, %, TOL 2008
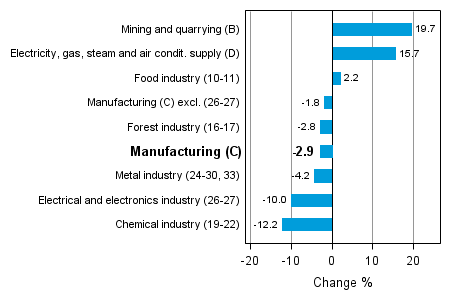
Industrial output diminished in several main industries in March. Output fell most in the chemical industry, by 12.2 per cent. Output in the electrical and electronics industry decreased by 10.0 per cent and in the metal industry by 4.2 per cent. Among main industries, output increased most in mining and quarrying, which grew by nearly 20 per cent compared with the year before. The output in the food industry grew by 2.2 per cent from March 2012.
Working day adjusted change in industrial output by industry 3/2012-3/2013, %, TOL 2008
Capacity utilisation rate in manufacturing (C) was 79.6 per cent in March, or 4.3 percentage points lower than one year earlier. In the forest industry, capacity utilisation rate was 84.1 per cent in March, or 1.3 percentage points lower than in March 2012. In the metal industry, capacity utilisation rate was 79.4 per cent in March, which was 7.1 percentage points lower than one year earlier.
Revised data for March 2013 will be published at 9 am on 10 June 2013 in connection with the release of industrial output data for April 2013. The revision is influenced by the estimation used in the latest release, which concerns the periodic tax return data used for enterprises with fewer than 50 employees. Because of the method used, seasonally adjusted figures for previous months may change even if the original figures do not become revised. The seasonally adjusted figures will also be adjusted for working days.
The base year 2010 is utilised for the calculation of the Volume Index of Industrial Output starting from the statistics for January 2013.
Source: Volume Index of Industrial Output 2013, March. Statistics Finland
Inquiries: Kari Rautio 09 1734 2479, Salla Simola 09 1734 3308, volyymi.indeksi@stat.fi
Director in charge: Hannele Orjala
Publication in pdf-format (331.3 kB)
- Reviews
- Tables
-
Tables in databases
Pick the data you need into tables, view the data as graphs, or download the data for your use.
- Figures
-
- Appendix figure 1. Working day adjusted change percentage of industrial output March 2012 /March 2013, TOL 2008 (10.5.2013)
- Appendix figure 2. Seasonally adjusted change percentage of industrial output February 2013 /March 2013, TOL 2008 (10.5.2013)
- Appendix figure 3. Trend of industrial output Finland, Germany, Sweden and France (BCD) 2000 - 2013, 2010=100, TOL 2008 (10.5.2013)
- Revisions in these statistics
-
- Revisions in these statistics (10.5.2013)
Updated 10.5.2013
Official Statistics of Finland (OSF):
Volume index of industrial output [e-publication].
ISSN=1798-9272. March 2013. Helsinki: Statistics Finland [referred: 12.6.2026].
Access method: http://stat.fi/til/ttvi/2013/03/ttvi_2013_03_2013-05-10_tie_001_en.html