28 February 2001
Inquiries: National Accounts: Mr Tuomas Rothovius
+358 9 1734 3360, Mr Olli Savela +358 9 1734 3316
General Government Deficit and Debt: Ms Paula Koistinen-Jokiniemi
+358 9 1734 3362 skt.95@stat.fi
Director in charge: Mr Markku Suur-Kujala
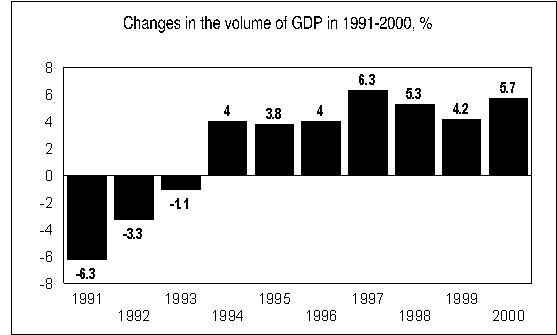
Gross domestic product grew by 5.7 per cent last year
According to Statistics Finland's preliminary data, Finnish GDP grew by 5.7 per cent in volume in the year 2000. Last year was the seventh consecutive year of growth. In the last quarter of the year, gross domestic product increased by 5.5 per cent compared to the corresponding time period of the year before.
Finland's gross domestic product, i.e. the total value added of the goods and services produced, was FIM 785 billion last year. National income per capita was FIM 125,000.

GDP was increased most by the 23 per cent growth of output in the metal industry, with strong growth in the manufacture of electrical and electronics products, in particular. In the wood and paper industry, output exceeded the previous year's figure by good 4 per cent.
Building construction increased by 6 per cent. Residential building slowed down toward the end of the year, but steady growth continued strong in the rest of building construction throughout the year. In the service industries, output increased by 3 per cent from the year before.
Demand in the national economy continued to hinge strongly on exports last year. The volume of exports grew by 18 per cent and that of imports by 13 per cent. In fact, net exports accounted for 3.5 percentage points of the total 5.7 per cent growth of GDP. In the final quarter of the year exports and imports grew by 14 per cent.
Private final consumption expenditure went up by 3 per cent last year, with slightly faster growth in the early part of the year. Car sales were less brisk than in previous years and demand for heating energy petered off towards the end of the year because of the mild weather. Government expenditure grew by around one-half of a per cent last year. The volume of investments grew by just short of 5 per cent last year. No growth was recorded in investments in machinery and equipment in the first quarter of the year, but the situation livened up toward the end of the year and the last quarter produced an increase of 10 per cent.
Enterprises' operating surplus reached a new record
The performance of enterprises reached a new record. The operating surplus of enterprises increased by 23 per cent and totalled FIM 141 billion. Enterprises also paid record taxes and dividends on the improved performance. The direct taxes paid by enterprises amounted to FIM 38 billion, which is 30 per cent more than in the year before. The dividends paid by enterprises totalled FIM 41 billion, which is 4 per cent more than in 1999.
The net lending of enterprises, describing their financial position, showed a surplus of FIM 42 billion, as against FIM 29 billion in the year before.
Households' real income almost unchanged
The disposable income of households grew by 2.9 per cent in nominal terms last year, but decreased by 0.3 per cent in real terms. Households' gross income increased considerably, but direct taxes grew even more, by 16 per cent, meaning that growth in their disposable income remained minor in nominal terms. The growth in the taxes paid by households is explained by growth in their earned income, profits on sales and share options, as well as the timing adjustments made in national accounts.
In nominal terms, the final consumption expenditure of households grew by 6.2 per cent, i.e. more than their disposable income. The savings rate fell to 0.7 per cent, having been 3.7 per cent in the year before. The rate was last this low in the 1980s.
General government surplus 6.7 per cent of GDP
The financial position of central government showed surplus for the first time since 1990 last year. The surplus was just short of FIM 26 billion. In currency terms the surplus was greater than ever before. Proportional to GDP, the surplus was last greater than this in 1976. The surplus resulted above all from exceptional growth of tax revenues.
The financial position of local government showed a small surplus of approximately FIM 1 billion, having been in deficit by FIM 2 billion in the previous year. The financial surplus of social security funds amounted to just short of FIM 26 billion, or FIM 5 billion more than in the year before.
The total net lending of general government, or so-called EMU surplus, was 6.7 per cent of GDP, or FIM 52.5 billion, as against the surplus of 1.8 per cent of GDP in the year before. At the year end, the gross debt of general government, or EMU debt, was 44 per cent of GDP, or FIM 346 billion. At the end of the previous year the EMU debt was 46.9 per cent of GDP.
The tax rate, or the proportion of taxes and statutory social security contributions of GDP, was 46.5 per cent last year, recorded in accordance with the statistical principles of the OECD. In the year before the tax rate was 46.2 per cent. Direct taxes increased considerably, but indirect taxes and social security contributions only went up very slightly.
Sources: National Accounts Preliminary Data, 2000.
Statistics Finland
General Government Deficit and Gross Debt According to EMU
Criteria. Statistics Finland.
