28 February 2002
Inquiries: Mr Rami Peltola +358 9 1734 3615, Mr Kari
Rautio +358 9 1734 2479
Director in charge: Mr Ilkka HyppŲnen
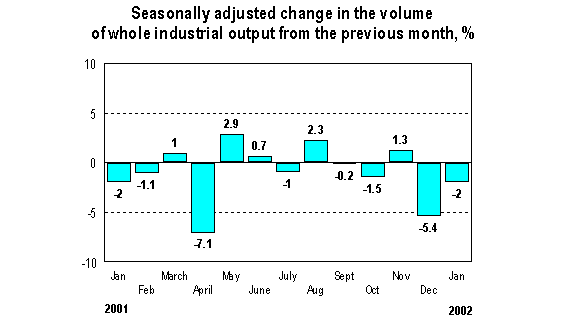
Industrial output fell by 2 per cent in January from December
According to Statistics Finland, seasonally adjusted industrial output was 2 per cent lower in January than in December. In December industrial output went down by 5.4 per cent from November. Seasonally adjusted output grew last in November when output rose by 1.3 per cent from October.

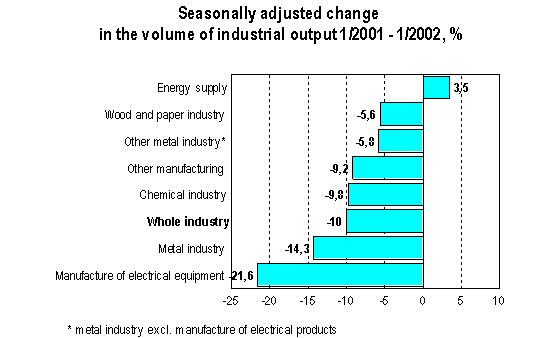
Output fell by 10 per cent in January from the year before
Compared to last year's January, seasonally adjusted industrial output went down by 10 per cent in January. Industrial output declined in nearly all of the main industries in January from the year before. Output in the electrical industry fell by almost 22 per cent and in the chemical industry by nearly 10 per cent. In the wood and paper industry output decreased by close on 6 per cent. An exception to this was energy supply, with a growth of 3.5 per cent.

Capacity utilisation rate in manufacturing was good 80 per cent in January, which is nearly 7 percentage points lower than in January 2001. In the pulp and paper industry, capacity utilisation rate was nearly 89 per cent, in the metal industry 79 per cent and in the chemical industry close on 78 per cent. Capacity utilisation rate in other manufacturing was 76 per cent.
Revised data for January will be published on 28 March 2002 at 8 am in connection with the industrial output data for February.
The base year of the Volume Index of Industrial Output changed
The base year and the calculation method of the Volume Index of Industrial Output have been changed. From January 2002 onwards, the new base year is 2000. At the same time a new method is introduced where industry-specific weights are changed annually, while until now fixed value data for the base year have been used as industry-specific weights. Fixed weights of the base year cause more bias the longer the distance is to the base year and the larger the structural changes that have occurred in industry. Starting to calculate with the variable weight index will reduce this bias.
Seasonally adjusted figures will be presented in press releases in accordance with international practices. Seasonally adjusted figures can also be compared to the previous month, which will show the turning points of the economy faster than comparison to the situation one year ago. On the other hand, seasonally adjusted figures change along with new observations more than figures calculated per working day.
Source: Volume Index of Industrial Output 2002,
January, preliminary data. Statistics Finland
StatFin statistical service at: statfin.stat.fi
