
25 February 2003
Inquiries: Mr Arto Kokkinen +358 9 1734 3355
Director in charge: Mr Ari Tyrkkö
GDP grew by 0.1 per cent in December from the previous month
According to the trend of the Monthly Indicator of GDP calculated by Statistics Finland, the volume of GDP was 0.1 per cent higher in December 2002 than in November. The strong growth rate of GDP in early 2002 stabilised between September and December in comparison to the previous months.
Volume of GDP in 1990-2002, trend and seasonally adjusted series
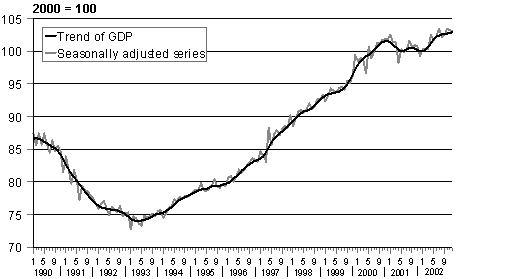
In December 2002 the volume of GDP was 39 per cent higher than in March 1993 at the depth of the recession and 20 per cent higher than in December 1989 at the height of the economic boom preceding the recession.
The economic time series can be divided into trend cycle, seasonal variation and random variation components. When the seasonal variation component is removed from the original series of GDP, a seasonally adjusted series is obtained, the changes in which still vary greatly from the previous month. When the seasonally adjusted series is also adjusted for the random variation component, the trend series that describes economic trends the most stably is left over. Seasonal variation and random variation components are removed by X11ARIMA models.
It should be noted that the series adjusted for seasonal and random variation become revised with new observations. The last three point figures of the trend cycle series should be taken with reservations because especially at the turning points new observations can change significantly the figures adjusted for seasonal and random variation.
GDP went up by 3.8 per cent from December 2001
When compared to December 2001, GDP increased by 3.8 per cent. In December 2002, output volumes grew in all the main industries of the monthly indicator, that is, in primary production, manufacturing, construction and trade, transport, and in other service industries.
Percentage changes of GDP from the previous year's corresponding month
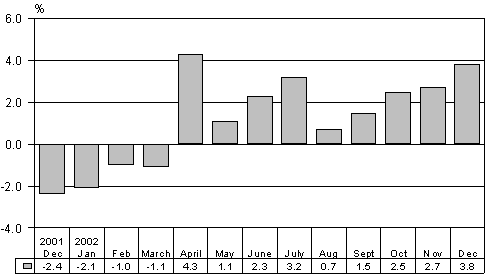
Industrial output as calculated per working day grew by 8 per cent. Output in the manufacture of electrical equipment increased by 20 per cent. In the wood and paper industry output rose by 10 per cent and in energy supply by 18 per cent. The volume of output grew by 2 per cent in the chemical industry.
Sale volumes of trade went up by 2 per cent. Wholesale trade increased by 3 per cent and sales of motor vehicles by just short of 2 per cent. Sales volumes in retail trade remained at the level of December 2001.
Output in agriculture and forestry went up by 6 per cent from December 2001. Meat production increased by 17 per cent and fellings strengthened by 6 per cent. Milk production fell by 2 per cent.
Construction increased by just short of one per cent. Transport livened up by 8 per cent. Output in other service industries rose by 1 per cent from December 2001.
The Monthly Indicator of GDP is based on twelve monthly series on different industries of the economy. The series are summed up by weighting. The purpose of the Monthly Indicator is to anticipate the development of the volume of the quarterly gross domestic product published later.
Year 2000 has been introduced as the new base year for the index series of the Monthly Indicator of GDP. As the base year changes, the level of the index series also changes. As the weights of subindices change the series also become retrospectively revised.
Source: Monthly Indicator of GDP 2002, December. Statistics Finland