
16 March 2003
Inquiries: Mr Pekka Myrskylð +358 9 1734 3555,
email vaalit.tilastokeskus@stat.fi
Director in charge: Ms Riitta Harala
Candidates top income earners
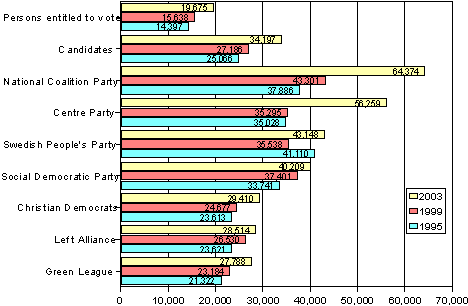
Parliamentary election candidates differ from the electorate most with regard to their income. According to Statistics Finland, the average taxable income of the candidates was EUR 34,200 in 2001, or 74 per cent more than that of those entitled to vote. The average income of persons entitled to vote was EUR 19,700. The candidates of the National Coalition Party and the Centre Party have about triple the income compared to persons with the right to vote.
In the now terminating parliamentary period, the nominal income of those entitled to vote rose by 26 per cent and that of all candidates by exactly the same amount. The income growth has been fastest among the National Coalition Party and Centre Party candidates. The average income of the Centre Party candidates has grown by 59 per cent and that of the National Coalition Party candidates by 49 per cent. The income growth has been 21 per cent for the Swedish People's Party candidates, 20 per cent for the Green Party candidates and 7 per cent for the Social Democratic Party candidates, which is well below the average growth rate among the total population.
Parliamentary election candidates by average income (in euro) in 2003, 1999 and 1995
In the 2001 taxation the income of most of the major party candidates was over EUR 31,999: 65 per cent of the National Coalition Party candidates, 56 per cent of the Centre Party candidates, 54 per cent of the Social Democratic candidates and 52 per cent of the Swedish People's Party candidates had an income of over EUR 31,999. Only 13 per cent of the electorate had an income exceeding EUR 31,999. During this period the group of those earning more than EUR 31,999 has grown particularly among the National Coalition Party, Centre Party and Swedish People's Party candidates.
The number of low-income earners was highest among the Green League, Left Alliance and Christian Democrats. The income structure of small parties resembles most the average income structure of the electorate.
Majority of candidates ageing men
In the Parliamentary elections 2,009 candidates were nominated, 1,208 of whom were men and 801 women. In relative terms, the lowest number of female candidates was nominated by the Centre Party and the Swedish People's Party, 42 per cent by both. The Social Democratic Party and the Centre Party have a male majority of just a few percentages and only the Greens have a female majority by a few percentages.
Of the candidates 43.1 per cent are women. In relative terms, the number of women is highest in the constituencies South Savo (45.3%) and Central Finland (45.2%). The number of female candidates is lowest in the constituencies of Hðme (35.5%) and Vaasa (37.3%).
The average age of male candidates is 47.9 and that of female candidates 43.6. The oldest male candidates are found in the constituencies of North Karelia (51.0) and Kymi (49.7) and the youngest female candidates in Central Finland (39.3) and North Karelia (40.7). The age difference between male and female candidates is largest in North Karelia, 10.3 years.
Majority highly educated employed persons
Highly educated people are seeking entry to the Parliament. The educational level of the candidates is in almost all parties higher than the average for the total population. Of the total population, 39 per cent rely on basic education but only 19 per cent of the candidates. The number of those having completed basic education is even lower among the major party candidates, that is, 11 per cent in the Centre Party, 5 per cent in the National Coalition Party, 2 per cent in the Swedish People's Party, 10 per cent in the Green League and 13 per cent in the Social Democratic Party. Nearly one half of the candidates have tertiary level education but only one quarter of those entitled to vote. The educational level is lower than average in the labour parties. Around one half of the Left Alliance and Social Democratic Party candidates have only basic or vocational qualifications.
One half of all persons entitled to vote are employed persons, 8 per cent are unemployed persons and students and 30 per cent pensioners. Almost all the candidates of the three largest parties are employed: 88 per cent in the National Coalition Party and the Social Democratic Party and 84 per cent in the Centre Party. Hardly any candidates are unemployed, and students and pensioners both make up about 7 per cent of the candidates. The Green League has the largest proportion of student candidates.
Source: Statistics Finland's election result service
Further information about the Parliamentary elections is available on the Internet at: tilastokeskus.fi/tk/he/vaalit/vaalit2003/vaalit2003_vaalitilastot_en.html and on the background of the Parliamentary election candidates at: tilastokeskus.fi/tk/he/vaalit/vaalit2003/vaalit2003_vaalitilastot_eatausta_en.html