27 February, 1998
Inquiries: National Accounts Mr Tuomas Rothovius +
358 9 1734 3360, Mr Olli Savela + 358 9 1734 3316; General
Government Deficit and Debt Mr Risto Suomela + 358 9 1734
3315
Statistical Director in charge: Mr Markku
Suur-Kujala
Production grew at peak year pace last year
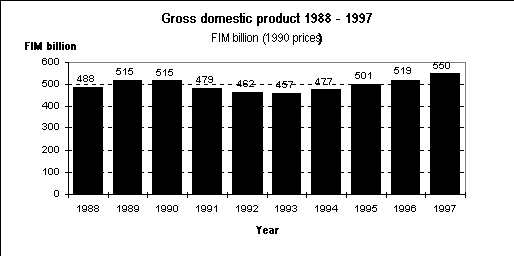
The volume of Finland's gross domestic product grew by 5.9 per cent last year, as indicated by the preliminary data on National Accounts by Statistics Finland. Comparable rates of growth were recorded in 1979, 7.0 per cent, and 1989, 5.7 per cent. Total output did, thus, clearly exceed the levels of the pre-recession peak years of 1989 and 1990. Last year's nominal GDP was FIM 618 billion.

Total output in manufacturing increased by approximately 9 per cent, headed by the wood and paper industry with a good 14 per cent growth. Output in the metal industry increased by over 11 per cent and in construction by 11 per cent, but output in land and water construction decreased by good 2 per cent. There was no growth on the previous year in output in the energy supply industry.
Demand was especially high for building investments, which increased by good 15 per cent, and exports, which grew by 13.5 per cent. Private consumption grew by over 3 per cent, whereas public consumption contracted slightly from the previous year.
National income grew by 8.6 per cent in nominal terms in 1997, and was FIM 99,100 per capita.
The real income of households grew for the third consecutive year in 1997. The disposable income of households grew by 5.5 per cent in nominal terms and by 4.1 per cent in real terms. The growth in the income of households was attributable, above all, to 4.5 per cent increase in the wage and salary bill, and lighter taxation. The final consumption expenditure of households increased by 4.5 per cent while their savings rate was 4.7 per cent.
The financial position of enterprises has shown a surplus since 1993. The surplus last year was FIM 22 billion, an increase of FIM 3 billion on the previous year.
Tax rate, or the share of taxes and compulsory social security contributions of the GDP, fell to 47.3 per cent last year, having been 48.0 per cent in 1996.
The financial deficit of central government amounted to approximately FIM 25 billion, having been FIM 42 billion in 1996. The financial position of local government swung to show a deficit of approximately FIM 1 billion last year. In accordance with National Accounts, the financial deficit of general government, inclusive of social security funds, amounted to nearly FIM 8 billion, or 1.3 per cent of GDP.
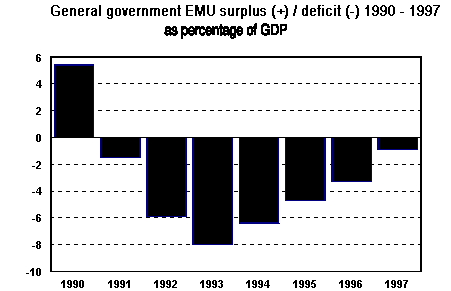
Last year's EMU deficit 0.9 per cent of GDP
General government deficit, used as one of the EMU convergence criteria, was FIM 6 billion last year. According to preliminary data, Finland's EMU deficit amounted to 0.9 per cent of GDP last year. The total gross debt of general government, or EMU debt, amounted to 55.8 per cent of GDP. The proportion of the financial deficit of GDP decreased for the fourth, and the debt ratio for the third year running. The statistics have been produced in accordance with the EU Commission's regulations concerning statistics on EMU debt and deficit, therefore the data do not agree with National Accounts data on financial deficit.

All information on National Accounts is based on preliminary data available on 20 February 1998, on the development of the national economy in 1997. Next revision of the data will take place on 23 March, 1998, when the National Accounts for the final quarter of 1997 will be published.
Sources: National Accounts Preliminary Data, 1997.
Statistics Finland
General Government Deficit and Gross Debt According to EMU
Criteria. Statistics Finland.
