

Published: 17 November 2017
Cold weather raised energy consumption in housing in 2016
Corrected on 1 February 2018. The corrections are indicated in red.
In 2016, electricity used in housing amounted to 67 terawatt hours (TWh). Consumption rose by nine per cent from the previous year. The year 2016 was clearly colder than 2015, although the heating demand during the year was still lower than the long-term heating demand. Compared to the previous year, consumption of heating energy in indoor spaces rose by twelve per cent. The energy consumption of household appliances went up by five per cent, which was mainly due to the grown heating demand of cars. The data are based on Statistics Finland's statistics on energy consumption in households.
Energy consumption in households 2010-2016 (Corrected on 1 February 2018)
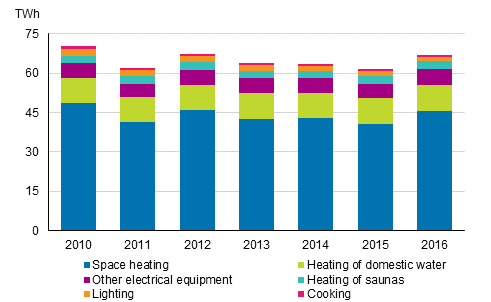
Heating of residential buildings amounted to sixty-eight per cent of energy consumption in housing, heating of domestic water fifteen per cent and heating of saunas five per cent. The share of electrical equipment, cooking and lighting was close on 13 per cent. Housing accounted, on average, for 20 per cent of the final energy consumption.
In 2016, electricity used on housing amounted to close on 23 TWh. Consumption of electricity rose by eight per cent from the previous year. Forty-seven per cent of electricity was used to heat indoor areas and 36 per cent to household appliances. The remaining share of electricity was used to heat domestic water and saunas. District heat and wood were the next most used energy sources in households.
Heating of residential buildings consumed 46 TWh of energy in 2016. Consumption rose by twelve per cent from the previous year. The most common sources of energy for heating indoor spaces were district heat, wood and electricity, the share of which was 85 per cent of the energy consumption for heating indoor spaces. The next most common energy source was heat pump energy. The use of heat pumps for heating has grown significantly from the start of the millennium. This is visible in the statistics as growth in both heat pump energy and electricity use. Heat pump energy refers to the energy extracted with heat pumps from the environment. The electricity use of heat pumps is included in electricity consumption of heating in the statistics on energy consumption in households. Heat pumps decrease the use of heating electricity when they replace conventional electric heating. In newbuilding and when replacing fuel oil, for example, electricity use grows. The cooling use of air heat pumps is currently included only in electricity consumption.
In addition to the area to be heated and the energy efficiency of the building stock, the need for heating energy is also affected by the outdoor temperature. Its changes are monitored with heating degree days. In the long-term comparison, the year 2016 was still warm, although it was clearly colder than the record-warm year 2015. However, consumption rose less than the number of heating degree days despite the fact that the area to be heated continues to grow by around one per cent per year. This indicates an improvement of energy efficiency.
Around three TWh of energy was used for heating saunas in 2016. Nearly two-thirds of energy were wood and good one-third electricity. The energy consumption of heating domestic water was 10 TWh.
The energy consumption of household appliances, that is, cooking, lighting and other electrical equipment, was good eight TWh in 2016. Appliances accounted for around 12 per cent of the entire housing energy. One per cent of this was used on cooking, that is, using cookers and ovens, and two-and-a-half per cent on lighting. The remaining nine per cent was used in other electrical equipment. They include small appliances for cooking, refrigeration equipment, washing machines, tumble dryers, televisions and computers with their accessories, lifts, and car interior heating. The colder winter than in the previous year raised the consumption of electricity for equipment. This was mainly due to the grown heatind demand of cars.
With respect to the consumption of heating energy in indoor spaces, domestic water and saunas, the statistics on energy consumption in households are based on Statistics Finland's calculation model where various sources were utilised. Part of the data have been estimated as the interval between the surveys used as data sources has become longer.
The concepts of the statistics correspond to the divisions of the European Union's Regulation on energy statistics concerning energy use in households. Based on the division, heating of indoor spaces and domestic water, cooking, electrical equipment, and heating of saunas are reported separately.
Source: Energy consumption in households 2016, Statistics Finland
Inquiries: Virve Rouhiainen 029 551 3395, energia@stat.fi
Director in charge: Ville Vertanen
Publication in pdf-format (249.4 kB)
- Tables
-
Tables in databases
Pick the data you need into tables, view the data as graphs, or download the data for your use.
Appendix tables
- Figures
Updated 17.11.2017
Official Statistics of Finland (OSF):
Energy consumption in households [e-publication].
ISSN=2323-329X. 2016. Helsinki: Statistics Finland [referred: 5.4.2026].
Access method: http://stat.fi/til/asen/2016/asen_2016_2017-11-17_tie_001_en.html