

Published: 31 July 2019
Prices of old dwellings in housing companies rose in Greater Helsinki in the second quarter of 2019
Corrected on 23 August 2019. The corrected numbers are indicated in red.
According to Statistics Finland's preliminary data, prices of old dwellings in housing companies rose compared to the corresponding quarter of last year by 1.6 per cent in Greater Helsinki, while in the rest of Finland they fell by 1.3 per cent. From the previous quarter, prices went up by two per cent in Greater Helsinki and by 0.8 per cent in the rest of Finland.
Development of prices of old dwellings in housing companies quarterly, index 2015=100
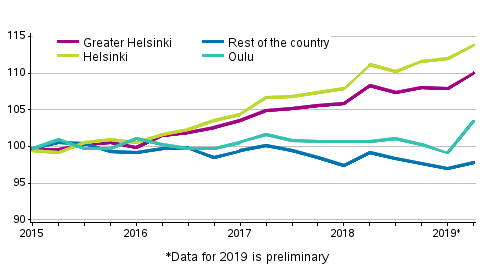
Among large cities, prices of old dwellings in housing companies rose most in Oulu from the previous quarter. In addition to Oulu, prices rose most in Turku and Helsinki compared with the corresponding quarter in 2018. In Espoo, Lahti and Tampere prices remained almost at last year's level. Prices of old dwellings in housing companies have risen in Oulu by 3.4 per cent compared to 2015. In Helsinki, prices have risen by close on 14 per cent. In the second quarter, the price for a square metre of a one-bedroom dwelling in a block of flats in the most expensive area in Helsinki was EUR 7,302 and in the most expensive area in Oulu EUR 2,396.
Preliminary data on price changes in Oulu in the latest quarter are based on 578 transactions and in Helsinki on 2,219 transactions. The preliminary data comprise, on average, two-thirds of completed transactions in old dwellings in blocks of flats and terraced houses.
Prices of old dwellings in housing companies, 2nd quarter 2019 1)
| Area | Price, EUR/m� | Index 2015=100 | Quarterly change, % | Yearly change, % |
| Whole country | 2 096 | 103.6 | 1.4 | 0.1 |
| Greater Helsinki | 3,745 | 110.0 | 2.0 | 1.6 |
| Rest of the country (whole country- Greater Helsinki) | 1 611 | 97.8 | 0.8 | -1.3 |
| Helsinki | 4,358 | 113.8 | 1.6 | 2.4 |
| Espoo-Kauniainen | 3,436 | 104.7 | 3.2 | 0.0 |
| Vantaa | 2,666 | 102.5 | 1.5 | 0.9 |
| Satellite municipalities 2) | 2,101 | 98.3 | 1.4 | -2.2 |
| Tampere | 2,501 | 108.4 | 1.7 | 0.4 |
| Turku | 2,106 | 109.8 | -2.1 | 2.5 |
| Lahti | 1,707 | 96.0 | 2.3 | 0.3 |
| Kuopio | 1,728 | 88.7 | -3.8 | -5.6 |
| Jyv�skyl� | 1,816 | 97.0 | 0.3 | -2.3 |
| Oulu | 1,790 | 103.4 | 4.4 | 2.7 |
2) Satellite municipalities = Hyvink��, J�rvenp��, Kerava, Kirkkonummi, Nurmij�rvi, Riihim�ki, Sipoo, Tuusula and Vihti
Compared with the same period in 2018, prices of new dwellings rose by 1.9 per cent in the whole country. In Greater Helsinki, prices went up by 9.7 per cent, while in the rest of Finland prices went down by 2.1 per cent. Prices of new dwellings in blocks of flats and terraced houses grew by 2.4 per cent in the whole country compared with the previous quarter. Prices went up by 5.1 per cent in Greater Helsinki and by 0.8 per cent in the rest of Finland.
Prices rose in June compared with the corresponding period of last year
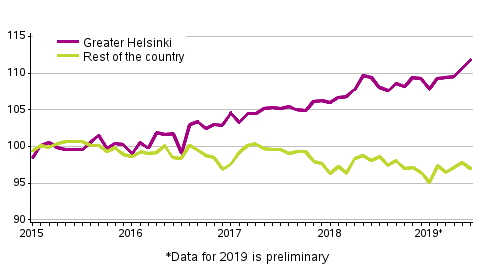
According to Statistics Finland's preliminary data, prices of old dwellings in blocks of flats and terraced houses rose in Greater Helsinki by 2.2 per cent, while in the rest of Finland they fell by 1.1 per cent compared to June 2018. In the whole country, prices went up by 0.6 per cent. Prices remained almost unchanged from May to June in the whole country. In Greater Helsinki, prices went up by one per cent, while in the rest of Finland they went down by 0.8 per cent.
Development of prices of old dwellings in housing companies by month, index 2015=100
When the monthly statistics on prices of dwellings in housing companies are published, they cover approximately 50 per cent of all transactions made in the latest statistical reference month. The monthly data become revised during the following months so that the final data for the year are published in the release concerning the first quarter of the following year. Further information about data revisions can be found in separate tables. It is not recommended to use the latest month’s number of transactions when describing the activeness of trading. Particularly in summer months, the number of transactions in the latest release of the monthly statistics may remain lower than usual and become revised in the coming months.
The information on old dwellings derive from the statistics on the prices of dwellings in housing companies compiled by Statistics Finland from the Tax Administration’s data. The preliminary data cover roughly two-thirds of completed transactions in old dwellings in blocks of flats and terraced houses. The data on new dwellings in blocks of flats are based on information on the transaction prices of the largest building contractors and estate agents. More detailed price data on dwellings in housing companies are available at http://tilastokeskus.fi/til/ashi/tau_en.html .
Source: Prices of dwellings in housing companies, Statistics Finland
Inquiries: Petri Kettunen 029 551 3558, Elina Vuorio 029 551 3385, asuminen.hinnat@stat.fi
Director in charge: Mari Yl�-Jarkko
Publication in pdf-format (422.2 kB)
- Tables
-
Tables in databases
Pick the data you need into tables, view the data as graphs, or download the data for your use.
Appendix tables
- Appendix table 1. Unencumbered prices per square metre of old dwellings in housing companies, June 2019 1) (31.7.2019)
- Appendix table 2. Unencumbered average prices per square metre of old blocks of flats, June 2019 1) (31.7.2019)
- Appendix table 3. Unencumbered average prices per square metre of old terraced houses, June 2019 1) (31.7.2019)
- Appendix table 4. Number of known transactions of old dwellings in housing companies in the early part of the year (31.7.2019)
- Figures
-
- Appendix figure 1. Average prices per square meter of dwellings in old blocks of flats (31.7.2019)
- Appendix figure 2. Average prices per square meter of dwellings in old terraced houses (31.7.2019)
- Appendix figure 3. Price development of old dwellings in blocks of flats in Helsinki Metropolitan Area, index 2015=100 (31.7.2019)
- Appendix figure 4. Price development of old dwellings in blocks of flats in Tampere, Turku, Oulu and Kajaani, index 2015=100 (31.7.2019)
- Appendix figure 5. Real Price Index of old dwellings in blocks of flats, index 1970=100 (31.7.2019)
- Quality descriptions
- Revisions in these statistics
-
- Revisions in these statistics (31.7.2019)
Updated 31.7.2019
Official Statistics of Finland (OSF):
Prices of dwellings in housing companies [e-publication].
ISSN=2323-8801. June 2019. Helsinki: Statistics Finland [referred: 29.6.2026].
Access method: http://stat.fi/til/ashi/2019/06/ashi_2019_06_2019-07-31_tie_001_en.html