

Published: 15 June 2021
Turnover and sales volume increased in all industries of trade in April
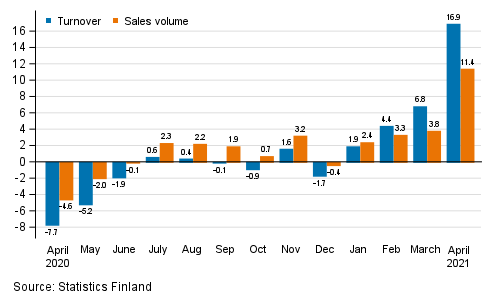
According to Statistics Finland, turnover in total trade adjusted for working days grew in April by 16.9 per cent from April 2020. Over the same period, the working day adjusted volume of sales in total trade, from which the impact of prices has been eliminated, increased by 11.4 per cent. The positive development in total trade that started in January of the current year also continues in April. The development of trade industries was partly affected by the exceptionally weak growth one year ago caused by the corona pandemic. This is now visible as high growth figures for some trade industries.
Annual change in working day adjusted turnover and sales volume in total trade (G), %
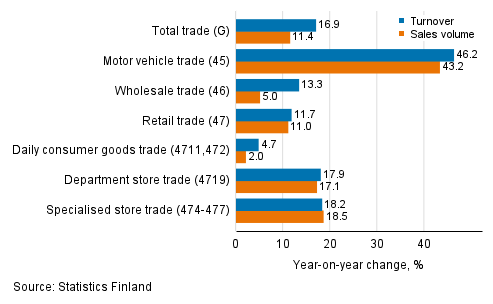
Motor vehicle trade shows strong growth in April as well
Adjusted for working days, turnover and sales volume increased in all industries of trade in April. Among the industries of trade, motor vehicle trade grew most. Motor vehicle trade has developed briskly throughout the early part of the year. In April turnover in motor vehicle trade rose by as much as 46.2 per cent and sales volume by 43.2 per cent from one year back. The growth in motor vehicle sales was considerably affected by the weak development one year ago caused by the corona pandemic.
The positive development in the biggest industry in trade, wholesale trade, which started in February, also continued in April. Turnover grew by 13.3 per cent and sales volume by 5.0 per cent year-on-year. The more favourable development in turnover than in sales volume in wholesale trade is explained by risen prices especially of processed petroleum products.
In retail trade, working day adjusted turnover grew in April in total by 11.7 per cent and sales volume by 11.0 per cent. The biggest growth among retail trade industries was seen in department store trade and specialised store trade. Turnover in department store trade rose by 17.9 per cent and sales volume by 17.1 per cent. In specialised store trade, turnover increased by 18.2 per cent and sales volume by 18.5 per cent from April 2020. Among retail trade industries, the development was weakest in daily consumer goods trade, where turnover rose by 4.7 per cent and sales volume by 2.0 per cent from a year ago.
Annual change in working day adjusted turnover and sales volume in industries of trade, April 2021, % (TOL 2008)
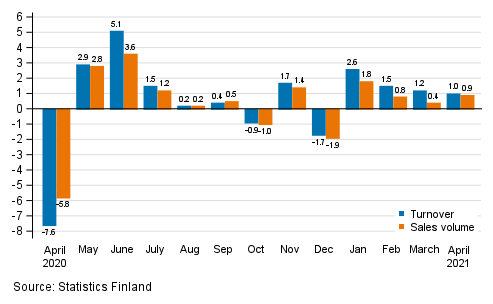
Both turnover and sales volume increased compared to March
Seasonally adjusted turnover in total trade grew by 1.0 per cent in April compared to March. Seasonally adjusted sales volume grew by 0.9 per cent during the same period. In March, turnover rose by 1.2 per cent and sales volume by 0.4 per cent from the month before.
Change in seasonally adjusted turnover and sales volume in total trade (G) from the previous month, %
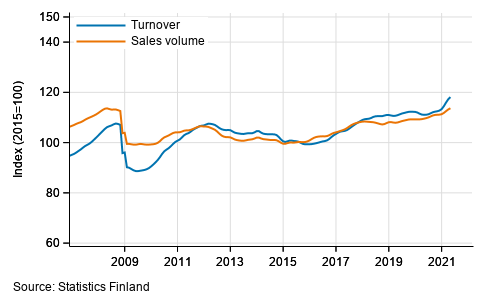
Trend of turnover and sales volume in total trade
The calculation of indices of turnover of trade is based on the Tax Administration’s data on self-assessed taxes, which are supplemented with Statistics Finland’s sales inquiry. The volume index of sales is calculated by removing the effect of price changes from the value index series.
The factors caused by the variation in the number of weekdays are taken into account in adjustment for working days. This means taking into consideration the lengths of months, different weekdays and holidays. In addition, seasonal variation is eliminated from seasonally adjusted series, on account of which it makes sense to compare observations of two successive months as well.
The data for the latest month are preliminary and they may become significantly revised particularly on more detailed industry levels in coming months.
Source: Turnover of trade, Statistics Finland
Inquiries: Suvi Kiema 029 551 3509, Mauri Niiniaho 029 551 3409, palvelut.suhdanne@stat.fi
Head of Department in charge: Katri Kaaja
Publication in pdf-format (289.8 kB)
- Tables
-
Tables in databases
Pick the data you need into tables, view the data as graphs, or download the data for your use.
Appendix tables
- Revisions in these statistics
-
- Revisions in these statistics (15.6.2021)
Updated 15.06.2021
Official Statistics of Finland (OSF):
Turnover of trade [e-publication].
ISSN=1799-0939. April 2021. Helsinki: Statistics Finland [referred: 14.12.2025].
Access method: http://stat.fi/til/klv/2021/04/klv_2021_04_2021-06-15_tie_002_en.html