

Published: 22 March 2013
Total energy consumption fell by 2 per cent in 2012
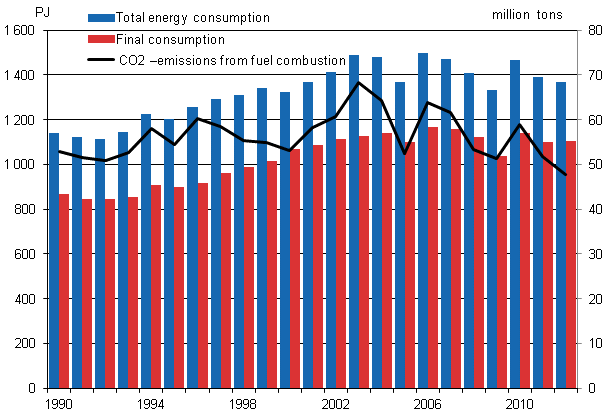
According to Statistics Finland’s preliminary data, total energy consumption in 2012 amounted to around 1,367 PJ (petajoule), or 380 TW (terawatt hours), which was two per cent less than in 2011. Consumption of electricity amounted to 85.2 TWh, up by 1.1 per cent year-on-year. Consumption of energy decreased by two per cent in transport and manufacturing, but the use of heating energy of buildings increased by over six per cent. Net imports of electricity to Finland went up by nearly 26 per cent. Carbon dioxide emissions from the production and use of energy diminished by close on eight per cent because six per cent less fossil fuels and 22 per cent less peat were used. The use of principally renewable energy went up by five per cent, since the energy produced with fossil fuels and peat was replaced more with imported electricity as well as with wood and domestic hydro power. According to preliminary data for 2012, renewable energy accounted for 30 per cent of total energy consumption.
Total energy consumption, final consumption and carbon dioxide emissions
Among individual energy sources, the largest reduction of 22 per cent was seen in the consumption of peat (19 PJ), while the second largest reduction of over 11 per cent was recorded in the consumption of coal (17 PJ). The shortage of peat was partly replaced with wood and with coal as well. Consumption of natural gas diminished by over 11 per cent (14 PJ). Net imports of electricity grew by 13 PJ, or by some 26 per cent, and consumption of nuclear energy by 2 PJ, or by around one per cent. Nearly one-quarter of Finland's total energy consumption was covered with wood fuels, which is almost as large as consumption of oil. According to preliminary calculations, the use of wood fuels grew by one per cent. The growth in the use of wood fuels was partly due to their increased use in heating instead of peat.
Final consumption of energy went up by one per cent. According to preliminary data, the share of manufacturing in final energy consumption was 46 per cent, which was one per cent lower in 2012 than twelve months before. Space heating of buildings accounts for one-quarter of final energy consumption, up by six per cent in 2012 because of the colder year. The use of energy consumption in transport went down by two per cent, the share of consumption remained almost on level with the year before.
Over 20 per cent of the electricity consumed in Finland was covered with imported electricity. Imports of electricity from the Nordic markets grew over seven-fold, being larger than imports of electricity from Russia. Imports of electricity from Russia decreased by 60 per cent. Domestic production of electricity went down by nearly four per cent. The production of condensate power decreased by 42 per cent, partly due to improved supply of hydro power in Sweden and Norway. Combined heat and power production diminished by almost 11 per cent. Combined heat and power production decreased by seven per cent in industry's combined power plants and by close on 11 per cent in district heating plants. The production of electricity by hydro power in Finland decreased by 35 per cent from one year earlier.
Diverse energy products were imported into Finland to the value of EUR 13.4 billion in 2012, which was one per cent less than in 2011. Correspondingly, energy products were exported from Finland to the value of EUR 6.3 billion, which was 13 per cent more than one year previously. The growth in Finland's energy products was due to livelier exporting of medium distillates and heavy fuel oil. In December, stocks of coal amounted to some 27 TWh, which was over 14 per cent less than one year earlier. Stocks of peat amounted to around 7.4 TWh in December, or some 35 per cent down on the year before.
Total energy consumption by source (TJ) and CO2 emissions (Mt)
| Energy source 4) | 2012* | Annual change-%* | Percentage share of total energy consumption* |
| Oil | 331,499 | -2 | 24 |
| Coal 1) | 131,849 | -11 | 10 |
| Natural gas | 115,973 | -11 | 8 |
| Nuclear Energy 2) | 240,760 | -1 | 18 |
| Net Imports of Electricity 3) | 62,796 | 26 | 5 |
| Hydro and Wind Power 3) | 61,455 | 34 | 4 |
| Peat | 66,030 | -22 | 5 |
| Wood fuels | 318,721 | 1 | 23 |
| Others | 38,730 | 7 | 3 |
| TOTAL ENERGY CONSUMPTION | 1,367,432 | -2 | 100 |
| Bunkers | 30,888 | -12 | . |
| CO2 emissions from energy sector | 48 | -8 | . |
2) Conversion of electricity generation into fuel units: Nuclear power: 10.91 TJ/GWh (33% total efficiency)
3) Conversion of electricity generation into fuel units: Hydro power, wind power and net imports of electricity: 3.6 TJ/GWh (100%)
4) *Preliminary
Source: Statistics Finland, Energy supply and consumption
Inquiries: Pentti Wanhatalo 09 1734 2685, energia@stat.fi
Director in charge: Leena Storg�rds
Publication in pdf-format (515.1 kB)
- Tables
-
Tables in databases
Pick the data you need into tables, view the data as graphs, or download the data for your use.
- Figures
-
- Appendix figure 1. Changes in GDP, Final energy consumption and electricity consumption (22.3.2013)
- Appendix figure 2. Carbon dioxide emissions from fossil fuels and peat use (22.3.2013)
- Appendix figure 3. Coal consumption (22.3.2013)
- Appendix figure 4. Consumption of natural gas (22.3.2013)
- Appendix figure 5. Peat consumption (22.3.2013)
- Appendix figure 6. Domestic oil deliveries (22.3.2013)
- Appendix figure 7. Total Energy Consumption 2012* (22.3.2013)
- Appendix figure 8. Total Energy Consumption 1975 - 2012* (22.3.2013)
- Appendix figure 9. Fossil fuels and renewables 1970 - 2012* (22.3.2013)
- Appendix figure 10. Electricity supply 1970 - 2012* (22.3.2013)
- Appendix figure 11. Energy and electricity intensity 1970 - 2012* (22.3.2013)
- Appendix figure 12. Imports and exports of electricity 1990 - 2012* (22.3.2013)
- Appendix figure 13. Share of renewables of total primary energy 2012* (22.3.2013)
- Appendix figure 14. Final energy consumption by sector 2012* (22.3.2013)
- Appendix figure 15. Final energy consumption by sector 2011 and 2012* (22.3.2013)
- Appendix figure 16. Total energy consumption and final energy consumption 1970 - 2012* (22.3.2013)
- Appendix figure 17. Electricity supply 2011 - 2012* (22.3.2013)
- Appendix figure 18. Production of district heat 1970 - 2012* (22.3.2013)
- Appendix figure 19. Electricity generation capacity in peak load period In the beginning of the year 2013 (22.3.2013)
- Appendix figure 20. Electricity consumption by sector 1970 - 2012* (22.3.2013)
- Appendix figure 21. Renewable energy as a proportion of final energy consumption in 2010, and the target for 2020 (22.3.2013)
- Appendix figure 22. Electricity consumption by sector 2012* (22.3.2013)
- Appendix figure 23. Finlands greenhouse gas emissions 1990 - 2011 (22.3.2013)
- Revisions in these statistics
-
- Revisions in these statistics (22.3.2013)
Updated 22.3.2013
Official Statistics of Finland (OSF):
Energy supply and consumption [e-publication].
ISSN=1799-7976. 4th quarter 2012. Helsinki: Statistics Finland [referred: 10.6.2026].
Access method: http://stat.fi/til/ehk/2012/04/ehk_2012_04_2013-03-22_tie_001_en.html