

This set of statistics has been discontinued.
Statistical data on this topic are published in connection with another set of statistics.
Data published after 5 April 2022 can be found on the renewed website.
1. Review on offences recorded by the police, customs and border guard
1.1. Abstract
In 2013, a total of 424,800 offences were recorded by the police, customs and border guard in the whole country, which is 640 (0.2 per cent) fewer than one year before. During the past ten years, the average number of offences recorded was 435,200 per year. Over the year, 246,000 offences were solved, while the corresponding figure was 254,300 one year previously.
The vast majority of the offences were recorded by the police. A total of 15,400 offences were recorded by the customs and border guard, which was 11.9 per cent more than one year before. Slightly over one-quarter of the offences recorded by the customs and border guard were alcohol offences or minor alcohol offences and narcotics offences.
Examined by region, the number of offences grew in the regions of Uusimaa, Satakunta, Ostrobothnia, North Ostrobothnia, Lapland and �land. The number of offences grew most in relative terms in Ostrobothnia, by 12.7 per cent. The number of offences fell most in relative terms in the region of Central Ostrobothnia, by 11.4 per cent from the year before.
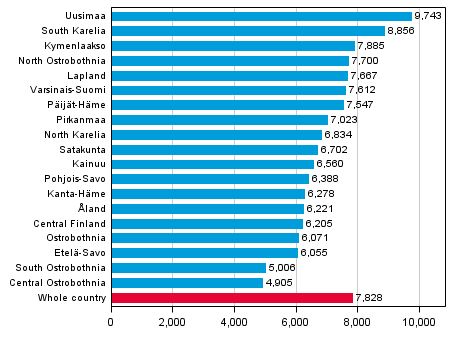
Relative to the population, the highest numbers of offences were recorded in the regions of Uusimaa, South Karelia and Kymenlaakso. In the whole country, 7,828 offences per 100,000 population were recorded.
Figure 1. Offences by region per 100,000 population in 2013
1.2. Offences against property
In 2013, 240,500 offences against property were recorded, which was 1.2 per cent more than the year before. The biggest group of the offences against property recorded was formed by thefts, petty thefts and aggravated thefts. In all, 141,400 of them were reported, which was 1.9 per cent more than one year previously. In the past ten years, an average of 148,600 theft offences (thefts, petty thefts and aggravated thefts) were reported. The number of thefts recorded in 2013 was 70,400, or 3.8 per cent more than one year before. The number of aggravated thefts fell by six per cent from 2012. In 2013, 3,050 of them were reported. The number of petty thefts recorded was 68,000, which was 0.4 per cent more than in 2012. One-third (47,500 offences) of theft offences were thefts and petty thefts from shops. Compared to 2012, shoplifting increased by 0.4 per cent.
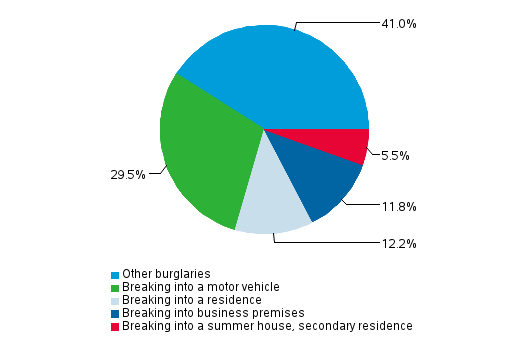
The number of burglaries (thefts, aggravated thefts or petty thefts through unlawful breaking in) has gone down considerably over the 2000s. In 2013, the number of burglaries was 32,500, which was 7.2 per cent lower than in 2012. The number of break-ins into free-time residences increased by 21.2 per cent. In 2013, 1,800 of them were reported. Breaking into residences went down most, by 17.6 per cent from the previous year. Breaking into a motor vehicle decreased by 10.6 per cent.
Figure 2. Burglaries (total 32,514 offences)
Eighteen per cent of offences against property were damages to property. In all, 43,400 of them were recorded, which was 2.3 per cent fewer than in 2012. Over the past ten years, an average of 50,200 damages to property have been recorded yearly.
Frauds make up around ten per cent of offences against property. The number of frauds (fraud, petty fraud, aggravated fraud) recorded was 22,800, which is nine per cent more than in 2012. In all, 7,600 means of payment frauds were recorded, which was 22.1 per cent more than in 2012. The number of both frauds and means of payment frauds has been growing over the past ten years. In 2013, 43.8 per cent of means of payment frauds were committed by the cardholder (targeting one's own account).
In 2013, 1,240 accounting and debtor offences were recorded, which is 4.2 per cent more than in the previous year. In the past ten years, an average of 1,140 of these offences have been recorded yearly. Forgery offences (forgery, petty forgery, aggravated forgery, possession of forgery materials) recorded was 3,780, which was 4.9 per cent down on 2012. Over the past ten years, an average of 4,660 forgery offences have been reported per year.
The number of robberies reported was 1,520, which was 5.7 per cent fewer than in 2012. Of robbery offences, 1,130, or 74 per cent, took place in a public place.
Figure 3. Offences against property 2013 (In total 240,547 offences)
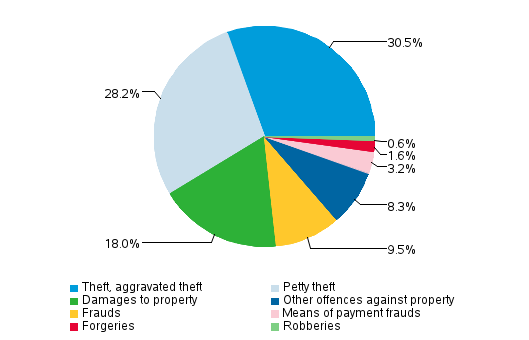
Table 1. Selected offences against property by region per 10,000 population in 2013
| Region | All offences against property | Burglaries | Unauthorised thefts of a motor vehicle | Robberies | Damages to property | Embezzlements | Frauds, means of payment frauds |
| Whole country | 4,433 | 599 | 147 | 28 | 799 | 66 | 561 |
| Uusimaa | 5,859 | 626 | 154 | 44 | 1,015 | 99 | 627 |
| Varsinais-Suomi | 4,436 | 778 | 220 | 35 | 680 | 47 | 511 |
| Satakunta | 3,714 | 814 | 139 | 15 | 740 | 53 | 439 |
| Kanta-H�me | 3,426 | 515 | 87 | 16 | 727 | 51 | 528 |
| Pirkanmaa | 4,126 | 609 | 128 | 25 | 861 | 52 | 479 |
| P�ij�t-H�me | 4,418 | 738 | 206 | 20 | 749 | 70 | 531 |
| Kymenlaakso | 4,013 | 633 | 159 | 19 | 768 | 50 | 453 |
| South Karelia | 3,733 | 520 | 143 | 22 | 660 | 50 | 409 |
| Etel�-Savo | 3,225 | 541 | 125 | 14 | 650 | 41 | 400 |
| Pohjois-Savo | 3,293 | 495 | 105 | 17 | 677 | 60 | 345 |
| North Karelia | 3,193 | 403 | 70 | 14 | 713 | 30 | 414 |
| Central Finland | 3,249 | 484 | 86 | 21 | 661 | 57 | 371 |
| South Ostrobothnia | 2,431 | 394 | 59 | 7 | 479 | 32 | 409 |
| Ostrobothnia | 3,415 | 532 | 135 | 16 | 875 | 20 | 333 |
| Central Ostrobothnia | 2,135 | 246 | 44 | 7 | 547 | 35 | 206 |
| North Ostrobothnia | 4,413 | 581 | 225 | 27 | 639 | 78 | 616 |
| Kainuu | 3,095 | 319 | 63 | 16 | 693 | 38 | 636 |
| Lapland | 3,793 | 608 | 181 | 20 | 736 | 53 | 429 |
| �land | 2,954 | 512 | 91 | 7 | 810 | 28 | 196 |
1.3. Offences against the person
In 2013, a total of 35,500 assault offences (assault, petty assault, aggravated assault) were recorded, which was 2,700 cases (7.1 per cent) fewer than in 2012. Aggravated assaults decreased by 4.4 per cent compared to the previous year. The number recorded was 1,800. Over the past ten years, 34,000 assaults, on average, have been reported yearly. The law reform, which entered into force at the beginning of 2011, considerably increased the number of assault offences recorded in 2011. After the legislative amendment, petty assaults on minors or close relatives became officially prosecutable. In 2011, 40,200 assaults were recorded.
The recorded number of offences against life was 95. This was six cases more than in 2012. The annual average for the past ten years was 115. The corresponding figure was 138 between 1994 and 2003. The number of attempted manslaughters, murders or killings fell by 86. The recorded number was 264.
In 2013, 61 per cent of offences against the person and 36 of assault offences were committed in private dwellings.
The number of rapes recorded was 975, while the figure was 1,009 in 2012. From 2004 to 2013, an average of 800 rapes were reported per year. The recorded number of sexual exploitations of a child was 1,657, which is 5.7 per cent more than in the year before. The reported numbers of rapes and sexual exploitations of a child vary much yearly. Individual reports may include a series of incidents comprising several criminal acts.
Table 2. Selected violent offences by region per 100,000 population in 2013
| Region | Manslaughter, murder, killing and their attempts | Assault | Aggravated assault | Petty assault | Rape offences |
| Whole country | 6 | 442 | 33 | 178 | 18 |
| Uusimaa | 6 | 532 | 29 | 189 | 20 |
| Varsinais-Suomi | 3 | 402 | 26 | 221 | 19 |
| Satakunta | 8 | 379 | 50 | 135 | 14 |
| Kanta-H�me | 10 | 310 | 39 | 200 | 16 |
| Pirkanmaa | 4 | 394 | 28 | 174 | 19 |
| P�ij�t-H�me | 8 | 383 | 39 | 175 | 16 |
| Kymenlaakso | 5 | 363 | 25 | 174 | 19 |
| South Karelia | 3 | 342 | 24 | 171 | 11 |
| Etel�-Savo | 3 | 343 | 27 | 227 | 20 |
| Pohjois-Savo | 10 | 395 | 39 | 246 | 12 |
| North Karelia | 7 | 353 | 39 | 177 | 16 |
| Central Finland | 9 | 507 | 39 | 139 | 16 |
| South Ostrobothnia | 5 | 336 | 29 | 77 | 9 |
| Ostrobothnia | 6 | 370 | 37 | 111 | 21 |
| Central Ostrobothnia | 7 | 536 | 18 | 169 | 8 |
| North Ostrobothnia | 6 | 428 | 35 | 144 | 15 |
| Kainuu | 8 | 593 | 39 | 231 | 11 |
| Lapland | 8 | 514 | 49 | 190 | 18 |
| �land | - | 459 | 24 | 122 | 21 |
1.4. Victims of offences and domestic violence
Victims of violent offences recorded in 2013 numbered 39,200, which was 12.6 per cent lower than one year earlier. Of the victims, 22,800 (58.2 per cent) were men and 16,400 (41.8 per cent) women. The share of male victims was 11.5 per cent and that of female ones 14.1 per cent lower than in 2012. A total of 34,600 persons were victims of assault offences, 20,900 (60.2 per cent) of them men and 13,800 (39.8 per cent) women. Information on victims is obtained reliably only on certain violent offences.
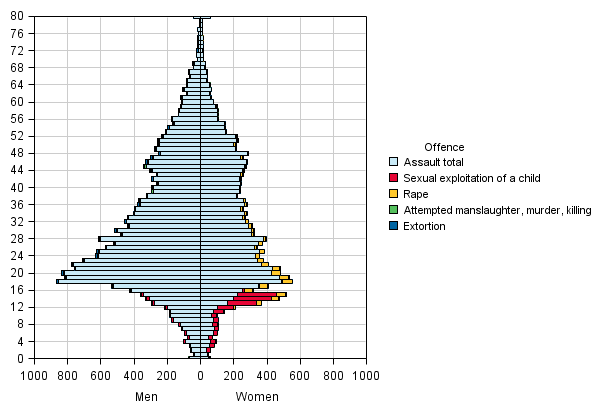
The typical age of victims of assaults is 18. This age group contained 1,340 (3.9 per cent) of all victims. In all, 4,900 (14.2 per cent) of victims of assaults were aged 50 or over. Assaults of children aged under 18 decreased by 9.7 per cent from the year before. Now, there were 5,300 child victims compared with 5,900 one year ago. This is 15.3 per cent of all victims of assault offences. Of child victims of assault offences, 3,300 (62 per cent) were boys and 2,000 (38 per cent) girls. Of child victims of assault offences, 27.5 per cent of the children belonged to the age group of those aged 0 to 9, 32.9 per cent to those aged 10 to 14, and 39.6 per cent to those aged 15 to 17. Of victims of sexual abuse as a child, 87.4 per cent were girls and 12.6 per cent boys.
Figure 4. Victims of certain offences by age and sex in 2013
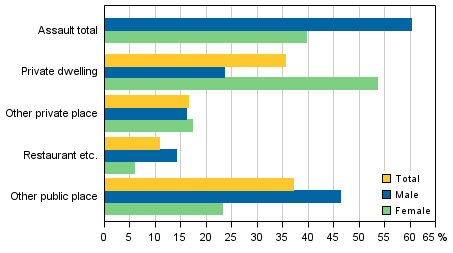
Good 35 per cent of assault offences were committed in private dwellings. Over one-half of assaults of women and nearly one-quarter of those of men were made in private dwellings. Good 45 per cent of assaults of men and almost one-quarter of those of women took place in a public place. Over ten per cent of assaults were made in restaurants or shopping centres.
Figure 5. Assault offences by scene and victim’s sex in 2013
Domestic violence
Table 3. Domestic violence by victim's sex and age 2013
| Victim/Relationship between victim and person suspected | Age groups total | - 14 | 15 - 20 | 21 - 29 | 30 - 39 | 40 - 49 | 50 - 59 | 60 - | |
| Total | Domestic violence total | 6,470 | 1,398 | 545 | 930 | 1,206 | 1,208 | 776 | 407 |
| Same household | 5,266 | 1,032 | 483 | 803 | 998 | 1,004 | 646 | 300 | |
| Near relatives | 1,204 | 366 | 62 | 127 | 208 | 204 | 130 | 107 | |
| Men | Domestic violence total | 2,050 | 709 | 191 | 200 | 270 | 322 | 215 | 143 |
| Same household | 1,627 | 523 | 165 | 177 | 234 | 265 | 174 | 89 | |
| Near relatives | 423 | 186 | 26 | 23 | 36 | 57 | 41 | 54 | |
| Women | Domestic violence total | 4,420 | 689 | 354 | 730 | 936 | 886 | 561 | 264 |
| Same household | 3,639 | 509 | 318 | 626 | 764 | 739 | 472 | 211 | |
| Near relatives | 781 | 180 | 36 | 104 | 172 | 147 | 89 | 53 | |
There were 6,470 victims in domestic violence offences recorded by the police, 13 per cent down on the previous year. Of victims of domestic violence, 68.3 per cent were women. The figures for domestic violence describe violence between present or former family members living in the same dwelling. Good one-half of these cases are violence between married or cohabiting couples, so called intimate partner violence. Only one-fifth of victims of intimate partner violence were men.
1.5. Drunken driving and traffic offences
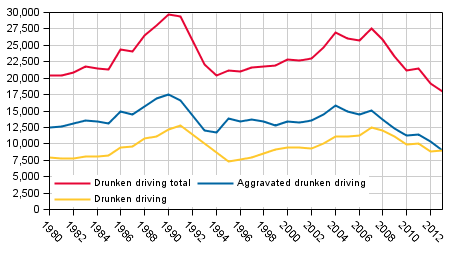
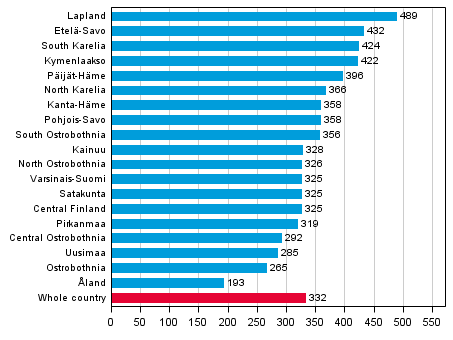
Aggravated drunken driving decreased by 12.9 per cent and other drunken driving increased by 2.2 per cent from 2012. In all, 18,000 drunken driving offences were recorded, which was 1,100 cases or six per cent lower than in the previous year. The number of drunken driving offences known to the police was at its lowest in 30 years in 2013. They have fallen by over one-third from the record figures of 1990.
In 78.3 per cent of drunken driving cases the intoxicant was alcohol and in 18 per cent some other narcotic substance. The remaining 3.7 per cent had used both. Drunken driving caused by alcohol decreased by 11.3 per cent and that caused by narcotic substances increased by 23.4 per cent.
Figure 6. Drunken driving offences in 1980–2013
In 2013, 444,600 cases of endangerment of traffic safety and traffic infractions were registered, which was 2.1 per cent more than one year before. Most of them were offences found out in connection with police surveillance and guidance. The recorded number of aggravated endangerment of traffic safety was 3,800, which was 4.8 per cent more than in 2012. The police recorded 315,800 cases of exceeding speed limits, which was 9.3 per cent more than in the year before. The figures for 2013 are not fully comparable with those for 2012, because exceeding speed limits detected by automatic traffic control towards the end of 2012 were recorded in the early part of 2013.
Figure 7. Drunken driving offences by region per 100,000 population in 2013
1.6. Offences involving intoxicating substances
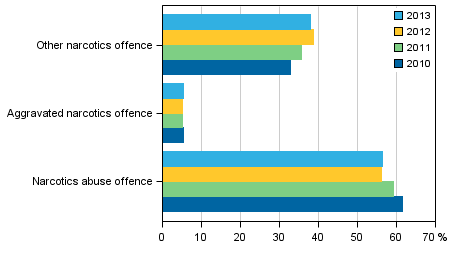
In all, 27,600 narcotics offences were recorded, which was 2,600 cases (12.7 per cent )more than in 2012. The number of aggravated narcotics offences went up by 20.7 per cent from the previous year. A total of 1,240 of them were recorded. The number of narcotics abuse offences grew most in absolute numbers, by 13.2 per cent. The recorded number was 12,800, which was 1,500 cases more than in 2012. The number of narcotics offences has been growing over the 2000s in nearly every year.
From 2009, the figures include the offences recorded by the customs and border guard, which increases the number of narcotics offences by about one-tenth compared with narcotics offences known to the police.
Figure 8. Narcotics offences in 2011–2013
The recorded number of alcohol offences and minor alcohol offences was 4,500, which was 2.8 per cent lower than in 2012.
When compiling statistics on offences involving intoxicating substances, offences comprising several criminal acts are entered as one. Offences involving intoxicating substances are such that they are generally found out only as a result of the activity of the police or customs and border guard officials and the majority of the offences remain undisclosed.
1.7. Solved offences
During 2013, the police, customs and border guard solved a total of 246,000 offences. The clearance rate was 57.9 per cent, which is two percentage points lower than in the previous year. The clearance rate for offences is calculated so that the offences recorded by the police in the statistical reference year and all the offences solved in that same year are compared with each other. For this reason, the clearance rate may be over 100.
In all, 37.8 per cent of offences against property and 77.1 per cent of offences against life and health were solved.
Among municipalities of over 30,000 inhabitants the clearance rate was the highest in Kajaani and Yl�j�rvi, 77.5 and 69.8 per cent, respectively. The lowest clearance rates were found in Helsinki and Salo, 50.8 and 50.7 per cent.
The clearance rate varies by type of offence quite strongly. Due to the manner of disclosure, drunken driving and traffic offences, and offences involving intoxicating substances almost all become solved. Sixty-nine per cent of frauds and 89.5 per cent of offences against life were solved. The clearance rate was 85.9 per cent for assault offences.
The clearance rates are the lowest for theft offences (theft, aggravated theft, petty theft), damages to property, means of payment frauds and unauthorised thefts of a motor vehicle. In 2013, one-sixth of thefts were solved. Nearly one-quarter of damages to property and one-sixth of means of payment frauds were cleared. One-third of unauthorised thefts of a motor vehicle were solved. Good one-half of robberies were solved.
Table 4. Clearance rate of certain types of offences in 1986-2013
| Offence | 1986 - 1990 | 1991 - 1995 | 1996 - 2000 | 2001 - 2005 | 2006 - 2010 | 2011 | 2012 | 2013 |
| All offences 1) | 65 | 51 | 51 | 56 | 61 | 59 | 60 | 58 |
| Theft | 25 | 17 | 14 | 15 | 18 | 17 | 16 | 15 |
| Aggravated theft | 39 | 29 | 40 | 41 | 38 | 34 | 38 | 38 |
| Petty theft | 78 | 70 | 67 | 58 | 57 | 57 | 56 | 56 |
| Robbery | 53 | 43 | 42 | 45 | 49 | 49 | 54 | 53 |
| Damages to property | 29 | 27 | 27 | 26 | 25 | 21 | 23 | 22 |
| Attempted manslaughter, murder or killing | 95 | 91 | 92 | 94 | 97 | 91 | 97 | 92 |
| Assault | 79 | 74 | 76 | 80 | 81 | 75 | 78 | 77 |
| Aggravated assault | 85 | 84 | 83 | 87 | 88 | 85 | 83 | 87 |
| Petty assault | 95 | 86 | 79 | 75 | 73 | 73 | 75 | 75 |
| Rape | 63 | 56 | 57 | 63 | 66 | 59 | 72 | 78 |
| Sexual exploitation of a child | 91 | 84 | 88 | 82 | 86 | 62 | 91 | 63 |
1.8. Persons suspected of offences
In all, 276,400 persons were suspected of the 246,000 offences solved in 2013. The same person can be a suspect of several different offences. In all, 18.4 per cent of such suspects were women. When calculating according to the most aggravated offence of a person (a person can be a suspect only one time during the year), 103,000 different persons were suspects. Thus, one person was a suspect of 2.7 offences, on average.
In addition to the quantitative difference, the criminality of men and women differs in that women's shares of assaults, drunken driving and damages to property were small compared to men. However, the share of women suspected of assaults and drunken driving has grown in 20 years. Typical crimes for women were petty thefts, frauds, embezzlements and forgeries. Women are also slightly younger than men. The most common age for a woman suspect is 19 and that for a man suspect is 20 years. The average age of suspects of both sexes is 32 years.
Table 5. Suspects of solved offences by age and sex in 2004-2013
| Year/suspects | Males total | Females total | Males aged under 15 | Females aged under 15 | Males aged 15-17 | Females aged 15-17 | Males aged 18-20 | Females aged 18-20 | Males aged over 20 | Females aged over 20 |
| 2004 | 250,087 | 47,028 | 8,342 | 3,182 | 20,063 | 4,763 | 33,466 | 5,670 | 188,216 | 33,413 |
| 2005 | 250,489 | 46,580 | 7,289 | 3,047 | 22,486 | 4,546 | 31,983 | 5,521 | 188,731 | 33,466 |
| 2006 | 239,264 | 45,093 | 6,934 | 2,725 | 19,296 | 4,093 | 28,830 | 5,783 | 184,204 | 32,492 |
| 2007 | 250,303 | 57,847 | 8,347 | 2,749 | 19,783 | 4,077 | 29,702 | 5,433 | 192,471 | 45,588 |
| 2008 | 257,955 | 50,240 | 10,577 | 3,198 | 20,592 | 4,207 | 30,388 | 5,987 | 196,398 | 36,848 |
| 2009 | 247,229 | 51,298 | 8,846 | 3,173 | 19,049 | 4,635 | 27,261 | 5,923 | 192,073 | 37,567 |
| 2010 | 249,123 | 52,930 | 8,023 | 3,414 | 18,542 | 5,053 | 27,431 | 5,722 | 195,127 | 38,741 |
| 2011 | 248,787 | 53,975 | 9,091 | 3,640 | 19,359 | 5,230 | 28,224 | 5,943 | 192,113 | 39,162 |
| 2012 | 233,156 | 49,896 | 6,930 | 2,738 | 16,532 | 4,338 | 26,485 | 5,439 | 183,209 | 37,381 |
| 2013 | 225,509 | 50,852 | 6,631 | 2,433 | 15,011 | 4,000 | 25,574 | 5,391 | 178,293 | 39,028 |
In 2013 the share of young and underage people - aged 21 or under - among all suspects was 21.4 per cent. The shares of young people were large for alcohol offences, robberies, damages to property and thefts of a motor vehicle. Of suspects of robberies, 37.8 per cent were young people and 44.4 per cent of suspects of damages to property. In all, 20.7 per cent of those suspected of assaults were young people.
1.9. Backgrounds of suspects
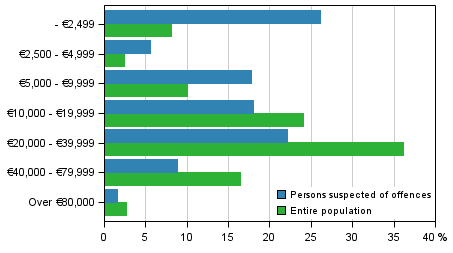
The average income subject to state taxation (income tax is paid to the state on both earned income and capital income) of suspects aged 15 or over belonging to the registered population (living permanently and temporarily in Finland) was around EUR 16,900, while the corresponding income in total population was about EUR 27,000. The respective median income was approximately EUR 9,600 and EUR 22,600. Of the suspects, 31.7 per cent had an income of under EUR 5,000 while the corresponding share for the entire population was 10.5 per cent. Among the suspects, 32.5 per cent had an income of at least EUR 20,000, while the share for the entire population was 55.3 per cent. All those whose income subject to state taxation is not known also belong to the group of under EUR 2,499. The figures given in Section 1.9 are calculated so that one person is a suspect only one time. The figures calculated here differ from the figures presented elsewhere in this publication where the same person can be a suspect several times during a year. Those guilty of endangerment of traffic safety or traffic infraction have not be taken into account in the figures. The data on income subject to state tax of suspects are based on the National Board of Taxes' data in the tax database concerning income subject to state taxation from 2012.
Table 6. Persons suspected of offences by sex and income subject to state taxation in 2013, aged 15 and over
| Sex | Total | – €2,499 | €2,500 – 4,999 | €5,000 – €9,999 | €10,000 – €19,999 | €20,000 – €39,999 | €40,000 – €79,999 | Over €80,000 | |
| Sex total | Persons suspected | 99,649 | 26,096 | 5,458 | 17,904 | 17,805 | 22,106 | 8,611 | 1,669 |
| % | 100.1 | 26.2 | 5.5 | 18.0 | 17.9 | 22.2 | 8.6 | 1.7 | |
| Men | Persons suspected | 78,605 | 20,581 | 4,255 | 13,572 | 13,420 | 17,722 | 7,562 | 1,493 |
| % | 100.0 | 26.2 | 5.4 | 17.3 | 17.1 | 22.5 | 9.6 | 1.9 | |
| Women | Persons suspected | 21,044 | 5,515 | 1,203 | 4,332 | 4,385 | 4,384 | 1,049 | 176 |
| % | 99.9 | 26.2 | 5.7 | 20.6 | 20.8 | 20.8 | 5.0 | 0.8 | |
Figure 9. Persons suspected of offences and the entire population by income subject to state taxation in 2013, aged 15 years and over
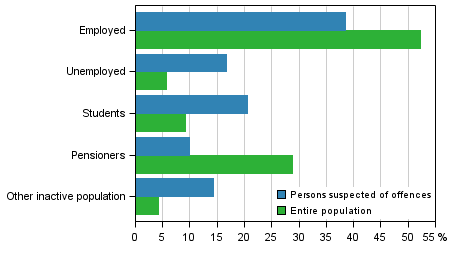
Classified by main type of activity, 38,6 per cent of suspects (belonging to the registered population aged 15 or over) were employed persons. Of all suspects, 16.7 per cent were unemployed and 14.4 per cent in the inactive population. Of the whole population, 52.2 per cent were employed, 5.2 per cent unemployed and 4.2 per cent in the inactive population. The information on main type of activity is from 2011.
Figure 10. Persons suspected of offences and the entire population by main activity in 2013, aged 15 and over
Of suspects aged 15 or over, 52.2 per cent had completed only basic level education and 37.5 per cent had completed secondary level education. The respective figures for the whole population were 31.3 and 40 per cent.
In Appendix tables 4 to 7, the same person can be a suspect several times. This is a common way to present the number of suspects of offences in the statistics. This produces a better view of criminality as a phenomenon and the backgrounds of the persons guilty of a particular offence can be described better.
1.10. Foreign citizens
The number of persons suspected of the offences solved in 2013 by the police, customs and border guard was 276,400, of whom 35,000 were citizens of foreign countries. Compared to 2012, the number of all suspects decreased by 2.4 per cent, while the number of foreign citizens suspected went down by 1.4 per cent. The number of foreign suspects has been, on average, 27,100 per year over the past ten years. The share of foreign nationals in all suspects was 12.6 per cent. The share has been growing slightly in recent years. In 2013, Russians and Estonians made up the biggest group of foreigners, both numbering 9,000. Of Estonian suspects, 40.6 per cent and 24.3 per cent of Russians had a permanent place of residence in Finland.
Other countries where over 1,000 of its citizens were suspected were Romania (2,100), Sweden (1,400), Iraq (1,400), Lithuania (1,300) and Somalia (1,300). Only 2.9 per cent of Lithuanians and 6.2 per cent of Romanians were living permanently in Finland. The respective percentages for Somalis and Iraqis were 93.7 and 77.8. Of Swedes, 63.6 per cent had a permanent place of residence in Finland. One person can be guilty of many different offences during a year.
Figure 11. Foreign citizens suspected of offences by place of residence in 2009–2013
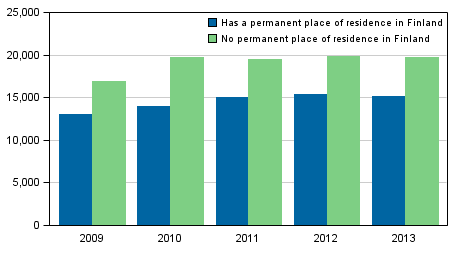
Among the offences solved in 2013, 43.4 per cent of the suspected foreign citizens were living permanently in Finland. The respective proportion has remained almost unchanged over the past few years. Foreign suspects living in Finland were slightly younger than Finnish suspects were. Their average age was 31 years, while that of Finnish suspects was 32 years. Typical offences by foreigners living in Finland were theft, assault and narcotics offences, as well as driving a motor vehicle without a licence.
In the statistics, the same person can be a suspect several times. Data on the nationality of suspects and on whether they are permanently resident in Finland or not are based on the nationality data derived from the police and those selected by means of the personal identity code from the population data. The group "no permanent place of residence in Finland" is in that sense problematic, because it may include persons staying longer periods in Finland without applying for a permanent place of residence here. The group may also include persons suspected of a narcotics offence, for example, who have come to Finland only for the purpose of committing a crime.
Table 7. Suspects of solved offences living in Finland by age and nationality in 2013
| Age group | Suspects living permanently in Finland | Share per 1,000 population in the age group | ||
| Finnish residents | Foreign citizens | Finnish residents | Foreign citizens | |
| -14 | 8,214 | 511 | 10 | 18 |
| 15-17 | 17,853 | 862 | 98 | 176 |
| 18-20 | 28,763 | 1,168 | 147 | 195 |
| 21-24 | 32,571 | 2,189 | 126 | 169 |
| 25-29 | 35,676 | 2,913 | 113 | 109 |
| 30-34 | 29,340 | 2,521 | 93 | 90 |
| 35-39 | 23,247 | 1,711 | 76 | 76 |
| 40-49 | 33,384 | 2,258 | 50 | 70 |
| 50-59 | 19,926 | 762 | 27 | 40 |
| 60-69 | 8,229 | 156 | 12 | 19 |
| 70- | 2,113 | 62 | 3 | 10 |
| Total | 239,316 | 15,113 | 46 | 77 |
If the number of suspects is calculated so that the same person can be a suspect of several crimes, the number of suspects with Finnish background was 234,800 (85 per cent of suspects). Of them, 227,600 were born in Finland and 7,200 abroad. Suspects with foreign background number 20,000 (7.2 per cent of suspects). Of persons with foreign background, 1,700 were born in Finland and 18,300 abroad. Among suspects, 4,400 (1.6 per cent) were of unknown origin and 17,200 (6.2 per cent) did not have population information. Population information is missing from tourists and those staying temporarily in the country, for example.
Source: Offences known to the police 2013. Statistics Finland
Inquiries: Kimmo Haapakangas 09 1734 3252, rikos@stat.fi
Director in charge: Riitta Harala
Updated 2.4.2014
Official Statistics of Finland (OSF):
Offences known to the police [e-publication].
ISSN=2242-7953. 2013,
1. Review on offences recorded by the police, customs and border guard
. Helsinki: Statistics Finland [referred: 16.7.2026].
Access method: http://stat.fi/til/polrik/2013/polrik_2013_2014-04-02_kat_001_en.html