This set of statistics has been discontinued.
Statistical data on this topic are published in connection with another set of statistics.
Data published after 5 April 2022 can be found on the renewed website.
Published: 13 December 2012
International trade in services clearly in surplus
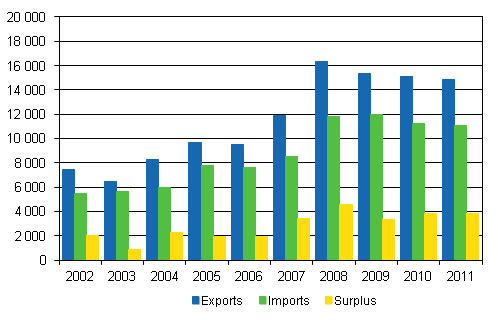
According to the final data on the statistics on international trade in services, the values of exports and imports of services declined in 2011. Services were exported to the value of EUR 14.9 billion, while imports of service amounted to EUR 11.0 billion. Both exports and imports went down by around EUR 0.2 billion compared with 2010, for which reason the surplus in international trade in services remained unchanged at around EUR 3.9 billion.
Imports, exports and surplus of foreign trade in services 2002–2011, mill. euro

Exports and imports of services differ clearly from one another in their structures. The most significant sources of export income from services are unclassified business services, computer and information services, and royalties and licence fees. Although unclassified business services are the biggest single service item, they have lost their share of exports from 2007 onwards. The share of royalties and licence fees has, in turn, been growing since 2006. The most significant service items in imports of services were research and development services and unclassified business services. Unclassified business services include merchanting and other trade-related services, operational leasing, other business services and unclassified intra-group services.
Examined by service item, the biggest surplus from international trade in services was generated from computer and information services and unclassified business services. Service items significantly in deficit are research and development services and advertising, market research and public opinion polling. From 2008, the surplus has grown in royalties and licence fees at a rate of around EUR 0.5 billion, to around EUR 1.4 billion in 2011. The deficit from unclassified business services amounted to EUR 0.9 billion in 2011, while in 2007 this item still showed a surplus of EUR 3.2 billion.
The main destination countries of service exports in 2011 were Sweden and the United States. Income from the United States was primarily made up of royalties and licence fees while exports to Sweden were more evenly divided into different service items. Exports of services to China and India declined considerably compared with 2010.
The most important countries of service imports were Germany, the United States, Sweden and the United Kingdom. Research and development services were the most imported items from Germany, the United States and the United Kingdom, while the biggest import items from Sweden were unclassified intra-group services. Imports from Germany continued to decrease, whereas imports from Sweden grew strongly from 2010.
The statistics on international trade in services are based on Statistics Finland's annual and quarterly inquiries on international trade in services. The data include service trade between group enterprises. The statistics do not include data on transport, tourism, insurance and financial services.
Source: Foreign trade in services 2011, Statistics Finland
Inquiries: Risto Sippola 09 1734 3383, Marjatta Tenhunen 09 1734 2927, globalisaatio.tilastot@stat.fi
Director in charge: Leena Storgårds
Publication in pdf-format (280.8 kB)
- Tables
-
Tables in databases
Pick the data you need into tables, view the data as graphs, or download the data for your use.
Appendix tables
- Appendix table 1. Imports of services by service type, 2002-2011, mill. euro (13.12.2012)
- Appendix table 2. Exports of services by service type, 2002-2011, mill. euro (13.12.2012)
- Appendix table 3. Exports of services by country, 2002-2011, mill. euro (13.12.2012)
- Appendix table 4. Imports of services by country, 2002-2011, mill. euro (13.12.2012)
Updated 13.12.2012
Statistics:
International trade in services [e-publication].
ISSN=1798-3525. 2011. Helsinki: Statistics Finland [referred: 22.2.2026].
Access method: http://stat.fi/til/pul/2011/pul_2011_2012-12-13_tie_001_en.html

