

1. Foreign direct investments in 2020
In 2020, the closing stocks of FDI both from Finland abroad and from abroad to Finland decreased from the previous year. At the end of 2020, the value of Finland’s inward FDI was EUR 73.8 billion, while one year before, the corresponding figure was EUR 76.4 billion.
The value of Finland’s outward FDI was EUR 117.1 billion at the end of the year. The drop from the previous year’s EUR 130.4 billion is largely explained by classification changes and price changes independent of the real economy, so it should not be concluded that 2020 would have been particularly bad for Finnish direct investors. Quite the contrary – a record value of EUR 5.8 billion was recorded as net returns on direct investments to Finland.
The review begins by summarising the data content and purpose of use of the statistics. After that, the development of direct investments worldwide during the exceptional year 2020 is examined in a number of ways. Section 1.3 describes in more detail the presentation of database tables that changed in autumn 2020 and the effect of flows on the net international investment position of direct investments. Both Finland’s inward and outward FDI in line with the directional principle will be examined next. Section 1.6 describes the importance of direct investments to the balance of payments. Finally, the statistics on direct investments are presented according to the ultimate investing country.
1.1 Data content and purpose of use
The statistics on foreign direct investments mainly depict financial transactions between domestic and foreign units in multinational groups and the assets and liabilities they generate, as well as international corporate acquisitions. The definitions of the concepts used in the review can be found in the statistics home page at: https://tilastokeskus.fi/til/ssij/kas_en.html . The netting of financial assets and liabilities according to the directional principle is described in more detail in the 2018 review.
The statistics on foreign direct investments do not, in most cases, describe foreign real investments into Finland. If, for example, a domestic company under foreign control makes a factory expansion investment in Finland and does not receive financing for this directly from a foreign investor, nothing of the value of the factory expansion investment is recorded in the statistics on direct investments. Foreign direct investments are often interpreted too simply as real investments but this is not often the case according to a study published by the Research Institute of the Finnish Economy (ETLA) in 2014 (ETLA 2014: Topias Leino and Jyrki Ali-Yrkk�: How does foreign direct investment measure real investment by foreign-owned companies).
According to Leino and Ali-Yrkk�, pass-through investments and enterprises' ownership changes do not often lead to real investments in the host country of the investment. Additionally if international enterprises operating in the country use domestic financing channels to finance their investments, this is not visible as a foreign direct investment. Strong concentration of entrepreneurial activity also creates challenges to the interpretation of FDI data: a large number of small investments made into growth enterprises are covered by the normal intra-group financing arrangements of multinational enterprises.
The industries used in the review describe the Finnish national TOL version derived from the statistical classification of economic activities in the European Community (NACE) and, for example, the industry category “technology industry” does not necessarily describe all enterprises belonging to the Technology Industries of Finland, but industry categories C24 to C26, C28. When speaking of industry figures, the exact industry category is always given and the same figures can be found in the database tables.
1.2 Global FDI
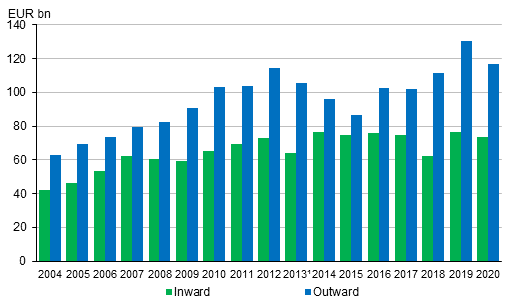
According to the investment report published by the United Nations Conference on Trade and Development (UNCTAD: World Investment Report 2021), flows of global foreign direct investment (FDI) contracted strongly due to the coronavirus pandemic in 2020. Measured in US dollars, flows decreased by 35 per cent and fell to the level of 2005. Measured in euros, flows contracted by 36 per cent. Less capital than in the previous year flowed to both developed, developing and transition economies. Investment flows to developed economies decreased in particular, as measured in euros they declined by 59 per cent.
The effects of the coronavirus pandemic on global FDI were focused on the first half of 2020. During the second half of the year, foreign direct investments recovered as concerns international corporate acquisitions and project financing agreements. The negative effects of the pandemic on investments that create new activities, which are particularly important for developing economies, continued in the second half of 2020 and the first quarter of 2021.
Figure 1. Global flows of direct investments in 2004 to 2020
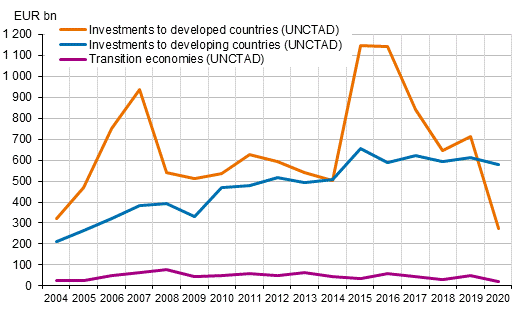
In total, global foreign direct investments amounted to EUR 875 billion in 2020, of which EUR 580 billion were directed at developing economies, EUR 273 billion at developed economies and EUR 21 billion at transition economies. The share of developing economies of the world’s FDI flows was around two thirds, while one year earlier, the corresponding share was still around one half. Examined by country, the United States was the largest host country of foreign direct investments followed by China and Hong Kong. The largest investor countries were China, Luxembourg and Japan.
Foreign direct investments to Europe decreased by 80 per cent from the year before. The fall in investment flows is partly explained by large fluctuations in pass-through investments. Investment flows decreased considerably to most large European economies, such as the Netherlands, Ireland, Cyprus and Great Britain. In contrast, investments to Luxembourg, Switzerland, Sweden and Belgium increased.
The investment report of the United Nations Conference on Trade and Development (2021) predicts global flows of foreign direct investments to level off and increase by around 10 to 15 per cent in 2021. In 2022, investment flows are expected to continue to grow and at best to rise to pre-pandemic levels. It is stressed that the prediction involves a high degree of uncertainty. The realisation of the growth forecast is affected, for example, by economic recovery, changes in the pandemic situation, the possible impact of economic recovery packages on direct investments, and political pressures.
1.3 Flows of FDI
FDI flows have conventionally been examined by bundling together financial transactions (T2) and reinvested earnings (T1). In connection with the release of FDI data for 2019 in autumn 2020, the database tables were updated so that reinvested earnings and dividends and interests paid to owners (NT) were combined into the variable “return on investments” and the flow variable (“Financial transactions excl. reinvested earnings”) includes only financial transactions (T2).
Whether reinvested earnings are part of flows or returns depends on the perspective. The source data for the calculations are the results of direct investments. Namely, the results of Finnish-owned affiliates, associate companies and branches abroad as well as the results of foreign-owned Finnish companies. An investor can repatriate part of the result as dividends and interests and leave part of the result as reinvested earnings in the investee's equity. The return perspective is supported by the fact that the returns included in the investee's balance sheet represent returns belonging to the investor just as dividends and interests paid out.
In addition, it is not an external flow but a return produced in the home country of the investment target, which a foreign investor has decided not to repatriate. Flows recorded as financial transactions are often based on some active decision: an investor can increase capital in the country to finance, for example, an acquisition or expansion of a production plant.
If, on the other hand, we look at changes in the value of the stock of investments during the year, reinvested earnings can well be regarded as flows: The closing stock LEt of a certain year equals the closing stock LEt-1 of the previous year plus flows that occurred during year t and other changes K.
LEt = LEt-1 + (T1t + T2t) + Kt.
Changes in stocks of investments are presented according to the equation above in Tables 1 and 2 of this review because the causes of changes in stocks are precisely interesting in them.
The database tables published since September 2020 are in turn based on the equation:
LEt = LEt-1 + (NTt + T1t) + T2t + Kt - NTt
The closing stock is thus the closing stock of the previous year + returns on investments + financial transactions + other changes - dividends and interests paid abroad. Because NTt is not published independently in the tables but only as part of returns on investments, the stocks and changes published in the database tables are not summed up evenly between different years. In order for the data to be even, it is necessary to deduct NTt from the closing stock as in the previous equation, which can be calculated from the table data as follows:
NTt = LEt-1 + (NTt + T1t) + T2t + Kt - LEt
For example, dividends and interests on direct investments paid abroad from Finland in 2020 totalled 76,394 + 5,535 + (-2,362) + (-1,388) - 73,758 = EUR 4,421 million. Because returns on investments are by definition NT + T1, reinvested earnings total 5,535 - 4,421 = EUR 1,114 million. The flow component T1 + T2 as in the previously published tables is in this case 1,114 + (-2,362) = EUR -1,248 million. Dividends and interests as well as flows described according to the previous style can be calculated in the same way with any variable selected in the table.
Figure 2 shows flows divided into reinvested earnings and financial transactions in 2006 to 2020. Finland’s inward and outward FDI is netted so that positive values reflect the strengthening of Finland’s net investment position, i.e. a situation in which the value of the stock of outward FDI rises more than that of inward FDI. For example, in 2020 the net amount of the flows is EUR 6.4 billion, so net capital outflow from Finland as financial transactions (3.9) and as reinvested earnings (2.5) was that much bigger than net capital inflow to Finland. The figure also shows the importance of financial transactions to the total level of flows: while reinvested earnings remain fairly stable from one year to another, financial transactions vary very much between years. Finland’s inward and outward flows in 2020 are examined in more detail in Sections 1.4 and 1.5.
Figure 2. Net flows of FDI in 2006 to 2020
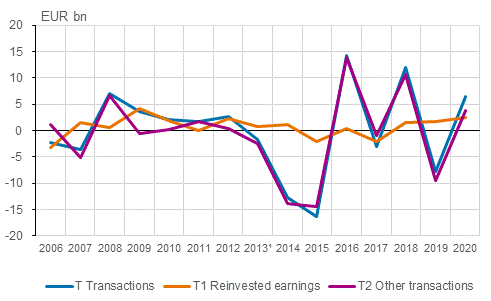
�) Starting from 2013, the figures are not fully comparable with those for 2006 to 2012 due to changes in the international statistical standard.
1.4 Finland's inward FDI
The value of Finland’s inward FDI stock fell by EUR 2.6 billion, from EUR 76.4 billion to EUR 73.8 billion during 2020. As financial transactions, foreign investors reduced their investments in Finland to the net value of EUR 2.4 billion. Reinvested earnings left in Finland totalled EUR 1.1 billion. Exchange rate and other valuation changes had a total effect of EUR -1.4 billion on the value of the stock of investments. The content of other valuation items is presented in more detail in Section 1.5.
In 2020, investments flowed into equity-based items as financial transactions to the tune of EUR 0.3 billion. In the case of debt capital (-2.6), a negative sign can be interpreted as meaning that the net amount of loans granted by foreign investors to Finnish subsidiaries decreased.
It should be noted that in the case of debt capital, there can be liabilities and assets equally from the affiliate to the parent company and vice versa. The change was now caused, on the one hand, by the decrease in the amount of debt taken by Finnish enterprises from their foreign owners and, on the other hand, by the increase in Finnish enterprises' assets from their foreign investors. Both changes had similar effects on the net figure.
Table 1. Finland's inward FDI, EUR billion.
| Total | Equity | Debt | |
| Stock of investments 31 Dec 2019 | 76,4 | 62,2 | 14,2 |
| Financial transactions excl. re-invested earnings | -2,4 | 0,3 | -2,6 |
| Re-invested earnings | 1,1 | 1,1 | 0,0 |
| Changes in the exchange rates | 0,1 | 0,0 | 0,1 |
| Other valuation adjustments | -1,5 | -1,0 | -0,5 |
| Stock of investments 31 Dec 2020 | 73,8 | 62,6 | 11,2 |
Examined by industry, the flows of manufacturing industry (industry C) caused EUR -1.5 billion on net of the negative flow of EUR 2.4 billion generated from financial transactions. Of this, the share of the chemical industry (C19-22) was EUR -0.5 billion. In the technology industry (C24-26, 28) the drop amounted to EUR 0.3 billion. A decrease of EUR 0.7 billion in investments in information and communication (J) and an increase of EUR 0.3 billion in financial and insurance activities (K) can be mentioned of the considerable changes in other fields.
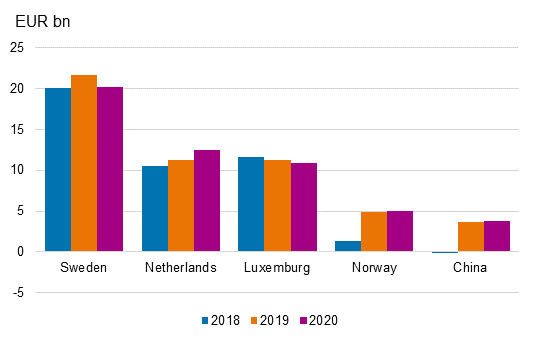
Examined by country, direct investments have been made to Finland particularly from Sweden (27% of the investment stock), the Netherlands (17%), Luxembourg (15%), Norway (7%) and China (5%). Examined by country group, investments to Finland mainly come from the EU area, whose combined share of the investment stock was 81 per cent in 2020. The share of euro area countries was 47 per cent of the investment portfolio. The shares presented here were calculated according to the immediate investor country. In fact, investments are often managed through an affiliate abroad, in which case the ultimate controlling investor is located in some other country. These figures calculated according to the ultimate investing country are examined in more detail in Section 1.7 of this review.
Figure 3. Direct investments to Finland according to the immediate investor country, stock of investments on 31 December
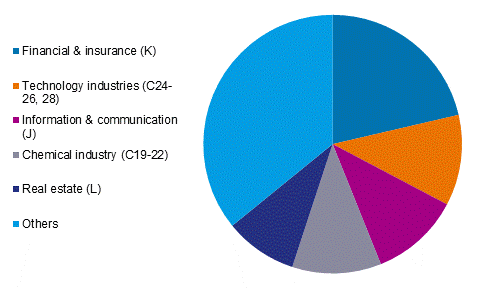
Examined by industry, Finland's inward FDI is directed to financial and insurance enterprises (21%), information and communication enterprises (11%) and real estate (L) enterprises (9%). In manufacturing, most investments have been made in technology industry enterprises (11%) and chemical industry enterprises (11%). The industry of the investment is determined based on the industry of the domestic unit. Then, the share of financing activities is increased by arrangements where a Finnish manufacturing enterprise, for example, is managed from abroad through a holding company classified in the financial sector and established in Finland for that purpose.
Figure 4. Finland's inward FDI by industry, stock of investments 31 December
In 2020, Finland's inward FDI generated returns of EUR 5.5 billion in total for foreign investors. Dividends amounting to EUR 4.0 billion and interests to EUR 0.4 billion were recorded in returns. In addition, reinvested earnings amounted to EUR 1.1 billion. Compared to 2019, all return items were now at a lower level: EUR 0.8 billion less dividends were paid and EUR 0.1 billion less interests than during 2019. Reinvested earnings reduced by EUR 1.0 billion.
In addition to the total level, returns generated by foreign investors also declined from the year before relative to the value of the stock of investments. In 2020, the returns amounted to 7.5 per cent, having been 9.7 cent in the year before. Examined by country, most returns on direct investments in Finland were generated to Sweden (EUR 2.2 billion), the Netherlands (1.3) and Luxembourg (0.6).
1.5 Finland's outward FDI
The closing stock of foreign direct investments abroad from Finland declined by EUR 13.3 billion in a year, from EUR 130.4 billion to EUR 117.1 billion. The drop is primarily explained by other valuation changes. These include price changes and classification changes caused by other than exchange rates. Classification changes refer to changes in the value of the asset or liability stock that are not caused by financial transactions between Finland and foreign countries. Classification changes include changes caused by intra-group capital reorganisations within multinational groups and value changes in the asset or liability stock caused by changes in the home country of the company head office.
The inquiries on foreign financial assets and liabilities, which are the main source data for the statistics, do not provide information on all factors affecting changes in the value of investments. Within the framework of the inquiries, the closing stock of investments at the end of a certain year is the closing stock of the previous year � financial transactions � dividends and interests � reinvested earnings. In addition, the data are enriched with exchange rate changes and with market value for listed companies. In a perfect world, the equation works well, but in practice, investment stocks are often influenced by other factors as well. Such differences that are not explained by inquiry data are recorded in other valuation changes. Large changes in the reported investment stocks are always validated by consulting the data supplier.
Except for other changes, all other items influencing the value of the investment stock were positive. Finland’s net outflow of financial transactions was EUR 1.5 billion during 2020, of which the share of debt capital was based clearly more on a decrease in liabilities (EUR -1.6 billion) than on an increase of EUR 0.1 billion in assets. Reinvested earnings increased the investment stock by EUR 3.6 billion, and a positive effect of EUR 0.5 billion was recorded from exchange rate changes.
Table 2. Finland's outward FDI, EUR billion
| Total | Equity | Debt | |
| Stock of investments 31 Dec 2019 | 130,4 | 132,0 | -1,6 |
| Financial transactions excl. re-invested earnings | 1,5 | -0,2 | 1,7 |
| Re-invested earnings | 3,6 | 3,6 | 0,0 |
| Changes in the exchange rates | 0,5 | 1,0 | -0,5 |
| Other valuation adjustments | -19,0 | -18,9 | -0,1 |
| Stock of investments 31 Dec 2020 | 117,1 | 117,5 | -0,4 |
Equity-based investments on net decreased as a result of financial transactions by EUR 0.2 billion, but the seemingly small figure hides interesting flows when viewed by industry: Investments in financial and insurance activities (industry K) grew by EUR 1.8 billion in the year while net investments in manufacturing (C) decreased by EUR 1.6 billion. In manufacturing, too, there was great variation within the industries. For example, the investment stock of the technology industry (C24-26, 28) decreased by EUR 2.9 billion, but the value of investments in the chemical industry (C19-22) increased by EUR 0.5 billion. EUR 0.3 billion flowed to wholesale and retail trade (G).
Reinvested earnings boosted investment stocks particularly in financial and insurance activities (EUR 1.5 billion), the technology industry (1.0) and the chemical industry (0.9).
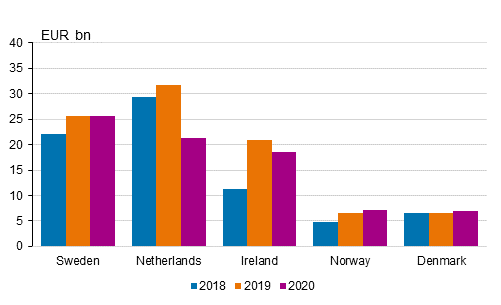
Examined by country, FDI from Finland is especially directed to Sweden (22% of the investment stock), the Netherlands (18%), Ireland (16%), Norway (6%), and Denmark (6%). Examined by country group, investments are mainly directed to the EU area, whose combined share of the investment portfolio was 79 per cent at the end of 2020. The share of the countries belonging to the euro area in the stock of outward FDI was 46 per cent.
Figure 5. Finland's outward FDI by immediate investor country, stock of investments on 31 December, EUR billion
The shares above were calculated according to the country of the immediate investment target. There are no data available on Finland’s outward FDI according to the country of the ultimate investment object, so it is not possible to give a more detailed specification of the final investment object. However, most of the investments directed abroad are connected to the management of a global enterprise or its part and the actual production activity is located in another investing country.
The industry of foreign direct investments from Finland is determined based on the industry of the Finnish investor. Examined by industry, outward FDI is held particularly by enterprises in financing and insurance activities (25% of the investment stock of all industries), the technology industry (22%) and the forest industry (C16-18) (12%).
In 2020, returns from outward FDI generated revenues for Finnish investors totalling EUR 11.3 billion. Of the returns, EUR 7.3 billion were dividends, EUR 0.4 billion interests and EUR 3.6 billion reinvested earnings. The amount of dividends paid to Finland decreased by EUR 0.8 billion from one year ago and EUR 0.2 billion less reinvested earnings were generated than in the previous year. The returns on interests were on level with 2019.
Relative to the value of the stock of investments, the returns received by Finnish investors remained almost unchanged, while the rate rose to 9.6 per cent from 9.4 per cent in 2019. Examined by country, Finland generated most returns in euros from Sweden (EUR 4.0 billion), the Netherlands (1.9 billion) and Singapore (0.8 billion).
1.6 Direct investments in the balance of payments
The figures for direct investments according to the directional principle presented in this review differ from the gross figures presented in the statistics on balance of payments and international investment position. The differing statistical method of balance of payments is discussed more in Section 2.2 of the review for the statistical reference year 2013.
At the end of 2020, the value of Finland's inward FDI stock was EUR 73.8 billion and that of outward FDI stock was EUR 117.1 billion. In 2020, the value of the stock of Finland’s both inward and outward FDI fell. The net international investment position of direct investments weakened as the value of the stock of outward FDI fell more than that of inward FDI. Foreign direct investment assets on net dropped to EUR 43.3 billion from the previous year's EUR 54.0 billion. As mentioned above, the weakening of the net investment position was primarily due to other valuation changes. By contrast, the net effect of recorded investment flows (T1 + T2) was EUR 6.4 billion.
In particular, direct investments improve the net international investment position of the enterprise sector. The net international position connected to direct investments is the same in the statistics on balance of payments and international investment position, although the gross figures of balance of payments differ from the figures presented here according to the directional principle.
Figure 6. Foreign direct investments in 2004 to 2020
�) Starting from 2013, the figures are not fully comparable with those for 2004 to 2012 due to changes in the international statistical standard.
In 2020, returns on inward FDI amounted in total to EUR 11.3 billion and on outward FDI to EUR 5.5 billion. This property income is recorded in the primary income item of Finland's current account and its net effect on Finland's current account was EUR 5.8 billion in 2020.
Net returns on direct investments grew from the previous year, although the level of returns generated for Finnish investors from abroad fell slightly. However, returns generated by foreign investors in Finland diminished more, so the net effect of the changes was positive. Figure 7 shows that returns connected to direct investments have improved Finland's current account throughout the reference period 2007 to 2020. The net effect of returns from foreign direct investments on the primary income of the current account has fluctuated between EUR 0.4 billion and EUR 5.8 billion.
Figure 7. Returns on FDI in 2007 to 2020
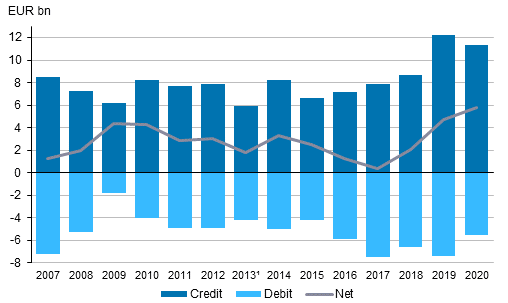
�) Starting from 2013, the figures are not fully comparable with those for 2007 to 2012 due to changes in the international statistical standard.
When examining the return figures, it should be borne in mind that the returns generated for “Finnish investors” are not equal to those generated for Finland or Finns. For example, relatively few Finnish listed companies have foreign owners with more than 10 per cent ownership, whereby the returns made by their foreign affiliates appear to remain in Finland in full if only the statistics on direct investments are examined. However, it is clear from Euroclear’s ownership statistics that many of Finland’s big listed companies have a fairly international ownership base. A majority of the returns on direct investments accrued to “Finnish investors” flows as returns from portfolio investments back abroad. In balance of payments, portfolio investments are foreign investments in which the holding or voting power remains below 10 per cent after the investment.
1.7 Investments according to the ultimate investing country
Direct investments have conventionally been examined only on the basis of the immediate investor country. The new statistical standards and data collected on a more detailed level than before also enable country-specific analyses of direct investments by the ultimate investing country starting from 2013. The ultimate direct investor in this connection refers to the one that is at the top of the control chain of the foreign direct investor. The ultimate direct investor is not controlled by any other unit and it may also be a domestic unit.
Figure 8 shows that examined by the home country of the immediate investor, clearly more direct investments to Finland have been made from Sweden, the Netherlands and Luxembourg than when viewed by the home country of the ultimate investor. This indicates that these investments are managed through a company domiciled in these countries, although the ultimate owner making the investment decisions is elsewhere. The opposite is true for the United States, Germany and China. In other words, a much larger share of FDI flows to Finland originate from these countries than the customary examination according to the immediate investor country would suggest.
When examined by the ultimate direct investor, the share of Finland should also be considered. This is because Finnish enterprises own domestic affiliates through their foreign affiliates. At the end of 2020, the closing stock of FDI to Finland, where the ultimate investing country was also Finland, stood at EUR -1.4 billion. A negative sign can be interpreted as meaning that these Finnish enterprises had on net more assets than liabilities from their foreign parent companies.
Figure 8. Foreign direct investments to Finland according to the immediate and ultimate investing country, stock of investments on 31 December
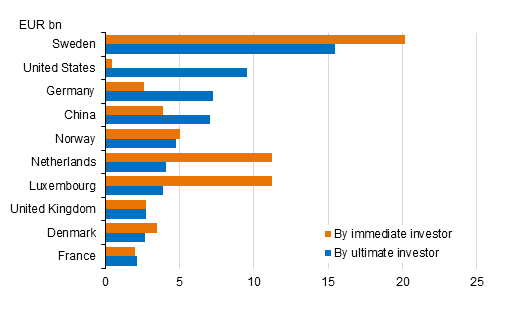
Figure 9 describes investment flows relative to the largest ultimate and immediate investing countries. The left-hand side describes the shares in the stock of investments according to the ultimate investing country. From top to bottom, the countries are Sweden, the United States, Germany and China. The blue bar at the top describes all other countries. The figure shows that more than half (53%) of investments originate in Finland from the four countries mentioned above according to the ultimate investing country.
On the right side of the figure, the countries are described in the order of the immediate investor: from top to bottom, Germany, Luxembourg, the Netherlands, Sweden and the rest of the world. Presented like this, the four major investor countries account for 63 per cent of total direct investments to Finland.
In addition to showing that investments concentrate on certain countries according to both the ultimate and immediate investors, there are also other interesting aspects that can be interpreted from the figure. Sweden has a thick bar running from left to right, which means that plenty of investments to Finland come directly from Sweden. Similarly, most of the investment stocks of many other ultimate investing countries geographically close to Finland (the other Nordic countries and Russia) come directly from the countries in question. On the other hand, investments from countries that are located farther geographically often come to Finland immediately through some country that is closer geographically: For the United States and Germany in particular, the figure shows that the bars on the left side spread evenly across different countries. Thus, investments from these sources often come to Finland through a transit country.
A practical example to facilitate the interpretation of the figure is a situation where a U.S. enterprise owns a Dutch holding company for its European operations, which in turn owns a Swedish parent company for Nordic operations, whose affiliate is located in Finland. Sweden is recorded in the statistics as the immediate investor country of this Finnish company and the United States as the ultimate investor country. From the perspective of Finnish statistics, the countries in the chain of ownership or their number between the ultimate and immediate investors are not significant.
Figure 9. Finland's inward FDI between the largest ultimate and immediate investors, stock of investments on 31 December
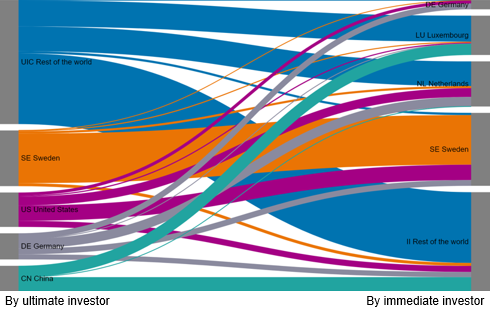
Through Sweden, plenty of investments also come to Finland from the United States, Germany and the rest of the world. Finland also receives much more investments through Luxembourg and the Netherlands according to the immediate than the ultimate investing country. These countries have long traditions and favourable conditions for financial sector actors, and Finland is by no means the only country where the share of these countries is highlighted.
1.8 Investments from Finland according to the highest controlling owner
It is not possible to compile statistics on Finland's outward FDI by ultimate investing country with the help of the available data sources. However, by examining the ownership chains of enterprises that have made foreign investments from Finland we can examine what proportion of Finland's outward FDI has been made by enterprises that are under Finnish control. The limitation of such an examination is also that it covers only the ownership chain of units in corporate form. For example, the actual owners of a parent company registered in Luxembourg can be Finnish private citizens.
At the end of 2020, the value of Finland’s outward FDI was EUR 117.1 billion, of which 90 per cent were held by enterprises under Finnish control. The United States (2%), Luxembourg (2%) and Sweden (1%) were the most significant ultimate investing countries outside Finland. Therefore, Finland cannot be regarded as a significant pass-through country for direct investments.
Source: Foreign direct investments 2020, Statistics Finland
Inquiries: Petri Kinnarinen 029 551 3428, balanceofpayments@stat.fi
Head of Department in charge: Katri Kaaja
Updated 17.9.2021
Official Statistics of Finland (OSF):
Foreign direct investments [e-publication].
ISSN=2342-351X. 2020,
1. Foreign direct investments in 2020
. Helsinki: Statistics Finland [referred: 23.6.2026].
Access method: http://stat.fi/til/ssij/2020/ssij_2020_2021-09-17_kat_001_en.html