

Published: 10 April 2013
Income differentials between population groups unchanged
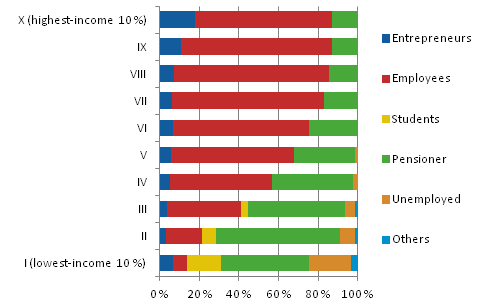
According to Statistics Finland's income distribution statistics, households' income have grown slowly since 2007 and there are no differences detectable in the development trends between population groups. Households with members that are active income earners in working life belong mainly to the higher end of the income distribution. Pensioners, students and the unemployed are usually found at the lower end of the income distribution.
Structure of income deciles by household's socio-economic group in 2011
In 2011, household income per consumption unit 1) was EUR 21,500 per year. The median of households’ income is based on measured monetary income, which includes wage and salary income, self-employment income and income from property of households, as well as income transfers received from other sectors. Taxes and tax-like payments have been deducted from the sum and this gives the net income of the household, which is then divided with the household's consumption units.
One-person and one-parent households are more frequently positioned at the lower end of the income distribution than others. The median for equivalent disposable monetary income of one-person households was EUR 16,400 in 2011, There were 1,036,000 one-person households in 2011, which represents approximately 40 per cent of all households. Nearly half of these households belong to the lowest-income quintile.
Viewed by the life cycle stage of the household, the best income level is found in households with two adults. Their income was EUR 25,700, in 2011. Three out of ten childless couples belong to the highest-income quintile. There were nearly 800,000 households formed by childless couples in 2011.
The median income of two-parent families with children was EUR 24,300 but that of one-parent families with children was only EUR 17,900. Of one-parent families with children, 40 per cent belongs to the lowest-income quintile, but among two-parent families with children only a little over ten per cent belong to this group. There were approximately 90,000 one-parent households, while there were nearly half a million two-parent households in 2001.
The income concept is equivalent disposable monetary income. Disposable monetary income does not include the imputed benefit from living in owner-occupied dwelling or capital gains 2) .
1) The consumption units are based on the so-called OECD's modified scale. One adult in the household is one consumption unit. Other persons in the household aged at least 14 each are 0.5 consumption units and children aged 0 to 13 each are 0.3 consumption units. A household with one adult member is one consumption unit, while a household consisting of spouses and one child aged under 14 together are 1.8 consumption units. Consumption units are used to calculate equivalent income which takes into account the size differences between households and enables their comparison with one another.
2) Comparison by households' population groups with different income concepts is possible with the help of income distribution statistic's database tables.
Source: Income Distribution Statistics 2011, Statistics Finland
Inquiries: Hannele Sauli 09 1734 3497, Kaisa-Mari Okkonen 09 1734 3408
Director in charge: Riitta Harala
- Tables
-
Tables in databases
Pick the data you need into tables, view the data as graphs, or download the data for your use.
Updated 10.4.2013
Official Statistics of Finland (OSF):
Income distribution statistics [e-publication].
ISSN=1799-1331. Income differentials between population subgroups 2011. Helsinki: Statistics Finland [referred: 12.6.2026].
Access method: http://stat.fi/til/tjt/2011/03/tjt_2011_03_2013-04-10_tie_003_en.html