This set of statistics has been discontinued.
New data are no longer produced from the statistics.
Published: 3 February 2012
The share of municipal tax in direct taxes has grown
In 2010 direct taxes and payments paid by income earners totalled EUR 25.3 billion, which was four per cent more than one year earlier. The amount of taxes on capital income grew most, by 33 per cent from the year before. In contrast, taxes paid on earned income went down by 4.6 per cent from the previous year. Municipal tax grew by 3.5 per cent and sickness insurance contributions by 23 per cent. Payments of municipal tax amounted to EUR 15.6 billion, taxes on earned income to EUR 5.1 billion and taxes on capital income to EUR 1.7 billion.
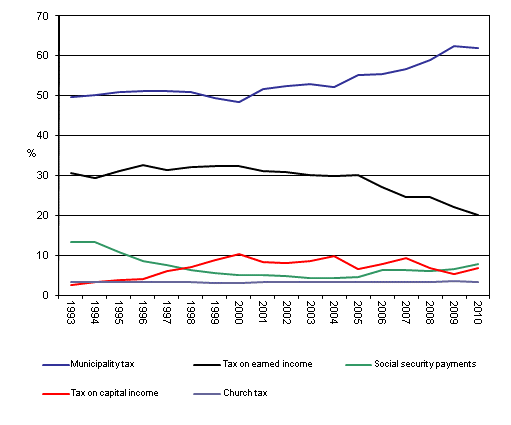
Shares of taxes in direct taxes 1993–2010, %

The share of municipal tax in direct taxes has grown in recent years and that of taxes on earned income has diminished. In 1993 municipal tax accounted for one half of direct taxes, in 2010 for as much as 62 per cent. At the same time, the share of taxes on earned income has gone down from 31 to 20 per cent. The share of taxes on capital income has grown from 2.3 to 6.7 per cent, but their amount has varied considerably by year.
Income earners paid 21.9 per cent of their taxable income in direct taxes and payments. The share of taxes in income did not change from the year before. The most taxes relative to income were paid by those having earned EUR 125,000 to 150,000 per year, 36.3 per cent of their income. Taxes claimed a smaller share of income from those having earned over EUR 150,000, i.e. 34.7 per cent. Capital income made up 46 per cent of the income of those having earned over EUR 150,000.
Of deductions most grew the basic deduction, whose maximum amount was raised to EUR 2,200. Its amount increased by 120 per cent from the previous year. Income earners had around one third less tax-deductible interests payable than in the previous year and deficit crediting decreased by the same amount. The tax allowance for household services grew less than in the previous years, by four per cent from the year before.
In all, income earners received taxable income to the tune of EUR 115 billion. In total, income grew by four per cent, earned income by three per cent and capital income by 27 per cent. Earned income received by income earners totalled EUR 108 billion and capital income EUR 6.9 billion. Wages and salaries increased by two per cent and pensions by four per cent. Of earned income most growth was recorded for daily unemployment allowances and other benefits based on unemployment security, up by around ten per cent. Of capital income most increased transfer gains, by 52 per cent from the previous year.
Source: Taxable incomes 2010. Statistics Finland
Inquiries: Timo Matala 09 1734 3422, toimeentulo@stat.fi
Director in charge: Riitta Harala
- Tables
-
Tables in databases
Pick the data you need into tables, view the data as graphs, or download the data for your use.
Updated 3.2.2012
Official Statistics of Finland (OSF):
Taxable incomes [e-publication].
2010. Helsinki: Statistics Finland [referred: 22.2.2026].
Access method: http://stat.fi/til/tvt/2010/tvt_2010_2012-02-03_tie_001_en.html

