

Published: 28 January 2022
Housing market calmed down toward the end of year
According to Statistics Finland's preliminary data, prices of old dwellings in housing companies rose by 3.1 per cent in the whole country and by 4.3 per cent in Greater Helsinki in the fourth quarter of 2021. Compared with the third quarter, prices went down by 0.3 per cent. In the fourth quarter, the number of old dwellings in housing companies sold through real estate agents was 1.1 per cent higher than one year before and in December it was 2.8 per cent lower than one year before.
Development of prices of old dwellings in housing companies quarterly in big cities, index 2015=100
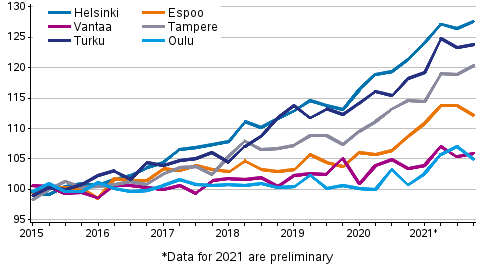
In the last quarter of 2021, prices rose compared with the previous year in all largest towns. Compared with the third quarter, prices fell in Espoo and Oulu and rose or remained on level with the previous quarter in other towns.
In December, prices rose from the previous year in all other towns but Turku. In December, prices rose by 1.9 per cent in the whole country and by 2.3 per cent in Greater Helsinki.
The average price per square metre of a one-bedroom dwelling in an old block of flats was EUR 8,329 in the centre of Helsinki, EUR 4,029 in the centre of Tampere and EUR 3,635 in the centre of Turku in the last quarter of 2021.
Regional differences in price development still substantial
In the whole of last year, the number of old dwellings in housing companies sold through real estate agents increased by 18 per cent from 2020. Seventeen per cent more old dwellings in housing companies were sold in Tampere and 12 per cent more in Helsinki than one year earlier. Fifteen per cent more transactions were made in Vantaa and Oulu and nine per cent more in Espoo and Turku.
According to preliminary data, prices of old dwellings in housing companies rose by 3.7 per cent in the whole country and by 5.5 per cent in Greater Helsinki last year compared with 2020. The prices of old dwellings in housing companies were rising strongly especially in the early part of the year, but the rise calmed down towards the end of the year. In the whole country, prices of dwellings both in blocks of flats and in terraced houses went up on average last year. Although it was a strong year for dwelling transactions, the differentiation of price development has not halted.
Compared with 2020, prices rose most among large towns in Helsinki, Turku and Tampere.
Examined by region, prices rose compared with 2020 most in Kymenlaakso, Uusimaa and Pirkanmaa last year. Prices fell most in North Karelia, Central Ostrobothnia and Central Finland.
Development of prices of old dwellings in housing companies by regions, quarterly, index 2015=100
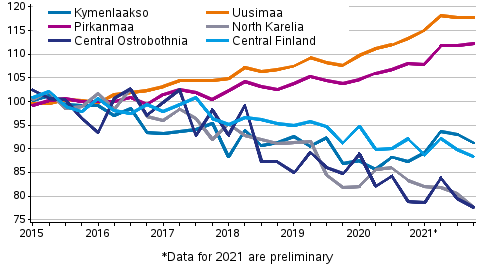
Compared with 2015, prices have gone up by nearly nine per cent, on average, in the whole country and by 20 per cent in Greater Helsinki. Regional differences and differences inside towns in price development and prices per square metre are, however, substantial.
Compared to 2015, prices of old dwellings in housing companies have risen in the six largest towns, Porvoo, Rovaniemi and Kerava.
Prices of old dwellings in housing companies, whole year 2021 1)
| Area | Price, EUR/m� | Index 2015=100 | Yearly change, % |
| Whole country | 2,179 | 108.7 | 3.7 |
| Greater Helsinki | 4,093 | 120.1 | 5.5 |
| Rest of the country (whole country- Greater Helsinki) | 1,638 | 98.5 | 2.0 |
| Helsinki | 4,775 | 117.8 | 6.1 |
| Espoo-Kauniainen | 3,789 | 112.6 | 5.5 |
| Vantaa | 2,856 | 105.6 | 2.2 |
| Satellite municipalities 2) | 2,190 | 98.7 | 2.3 |
| Tampere | 2,752 | 118.2 | 5.4 |
| Turku | 2,357 | 122.8 | 5.8 |
| Lahti | 1,653 | 94.2 | 4.1 |
| Kuopio | 1,818 | 90.6 | -0.3 |
| Jyv�skyl� | 1,743 | 92.4 | -1.3 |
| Oulu | 1,864 | 105.1 | 4.0 |
2) Satellite municipalities = Hyvink��, J�rvenp��, Kerava, Kirkkonummi, Nurmij�rvi, Riihim�ki, Sipoo, Tuusula and Vihti
Prices of new dwellings in housing companies rose in the last quarter
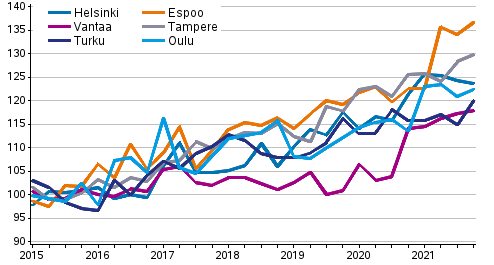
In the last quarter of 2021, prices of new dwellings in housing companies rose by 4.0 per cent compared to the corresponding period of 2020. In Greater Helsinki, prices rose by 5.4 per cent and in the rest of Finland by 2.5 per cent. Compared to the previous year, prices of new dwellings increased most in Espoo and Oulu.
Throughout last year, prices of new dwellings rose by an average of 5.6 per cent from 2020. Compared to 2015, prices of new dwellings have risen by around 21 per cent, on average.
Development of prices of new dwellings in housing companies quarterly, index 2015=100
The statistics on the prices of old dwellings in housing companies are based on the Tax Administration's data on dwellings (data on ownership of dwellings in housing companies). The numbers published from data on dwellings should not be used to assess the activeness of transactions in the latest periods.
When the monthly statistics on prices of old dwellings in housing companies are published for the first time, they cover approximately 60 per cent of all sales made in the latest statistical reference month. The quarterly statistics include around 70 per cent of transactions in the latest period. The data become revised during the following months so that the final data for the year are published in the release concerning the first quarter of the following year. Further information about data revisions can be found in separate tables.
The data on new dwellings in housing companies are based on information on the transaction prices reported by the largest building contractors and real estate agents. The numbers of old dwellings in housing companies sold through real estate agents are based on the data from the price monitoring service of the Central Federation of Finnish Real Estate Agencies. As a rule, these data do not become revised retrospectively.
Data on prices of dwellings in housing companies in different areas and by house type are available at stat.fi/til/ashi/tau_en.html. The tables also contain data on the prices per square metre at the municipal and postal code levels and on the numbers of transactions. If only a few transactions are known in the area, a couple of deviating cases may significantly affect the average price for an area and the price index.
Source: Prices of dwellings in housing companies, Statistics Finland
Inquiries: Petri Kettunen 029 551 3558, Elina Peltoniemi 029 551 3088, asuminen.hinnat@stat.fi
Head of Department in charge: Hannele Orjala
Publication in pdf-format (462.6 kB)
- Tables
-
Tables in databases
Pick the data you need into tables, view the data as graphs, or download the data for your use.
Appendix tables
- Appendix table 1. Prices per square metre of old dwellings in housing companies, December 2021 1) (28.1.2022)
- Appendix table 2. Unencumbered average prices per square metre of old blocks of flats, December 2021 1) (28.1.2022)
- Appendix table 3. Unencumbered average prices per square metre of old terraced houses, December 2021 1) (28.1.2022)
- Figures
-
- Appendix figure 1. Average prices per square metre of old dwellings in blocks of flats (28.1.2022)
- Appendix figure 2. Average prices per square metre of old dwellings in terraced houses (28.1.2022)
- Appendix figure 3. Price development of old dwellings in blocks of flats in Helsinki Metropolitan Area, index 2015=100 (28.1.2022)
- Appendix figure 4. Price development of old dwellings in blocks of flats in Tampere, Turku, Oulu and Kajaani, index 2015=100 (28.1.2022)
- Appendix figure 5. Real Price Index of old dwellings in blocks of flats, index 1970=100 (28.1.2022)
- Quality descriptions
- Revisions in these statistics
-
- Revisions in these statistics (28.1.2022)
Updated 28.1.2022
Official Statistics of Finland (OSF):
Prices of dwellings in housing companies [e-publication].
ISSN=2323-8801. December 2021. Helsinki: Statistics Finland [referred: 30.8.2025].
Access method: http://stat.fi/til/ashi/2021/12/ashi_2021_12_2022-01-28_tie_001_en.html