

Published: 24 April 2019
Parliamentary elections 2019, result of the control calculation
The control calculation of the election result did not change the power relationships of the parties. The Social Democratic Party became the biggest party in the Parliamentary elections with 17.7 per cent of all votes cast, which is 0.2 percentage points higher than the Finns Party's share of votes and 0.7 percentage points higher than the Coalition Party's share. The Green League increased its support most, by 3.0 percentage points. In relative terms, the Centre Party lost most votes, the party gained 13.8 per cent of the votes cast, which is 7.3 percentage points lower than in the previous Parliamentary elections. Detailed election results can be found in Statistics Finland's PX-Web database service.
Support for parties in Parliamentary elections 2011, 2015 and 2019
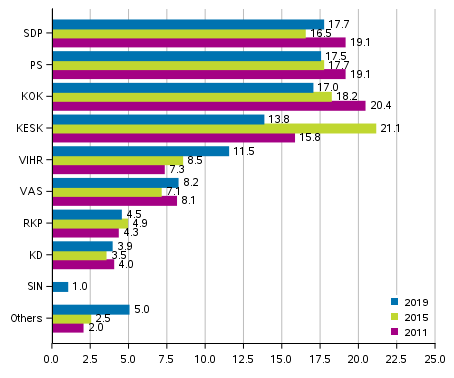
For the first time, all parties' support remained under 20 per cent and the differences between the three biggest parties were small. The Social Democratic Party gained a total of 546,471 votes, the Finns Party 538,805 and the National Coalition Party 523,957 votes. The Centre Party received 423,920 votes, which is over 200,000 votes fewer than in the previous Parliamentary elections. Except for the Green League and particularly the Centre Party, changes in the parties’ support were small. Apart from the parties mentioned above, the changes in support for the Parliamentary parties were at their biggest 1.2 percentage points either way. The Blue Reform that separated from the Finns Party gained 1.0 per cent of all votes cast and thus did not get any representatives in the new Parliament.
Groups outside the Parliamentary parties increased their support from the previous elections, now 5.0 per cent of persons who voted supported these groups. The group included parties outside the Parliament, constituency associations and groups having nominated candidates in the region of �land. Parties outside the Parliamentary parties gained a total of 63,452 votes, the number of votes cast for constituency associations in Mainland Finland was 76,506. Of the constituency associations in Mainland Finland, Movement Now also got a representative to the new Parliament.
Support for parties in Parliamentary elections 1945–2019, %
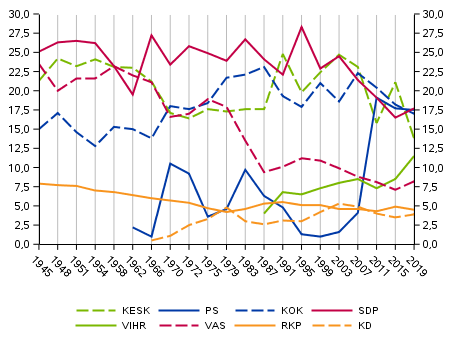
PS: 1962–1995 Finnish Rural Party (SMP); VIHR: 1983 not as a party of its own; VAS: 1945–1987 the Democratic League of the People of Finland (SKDL); KD: 1966–1999 Christian League of Finland (SKL)
Voting turnout rose from the previous Parliamentary elections
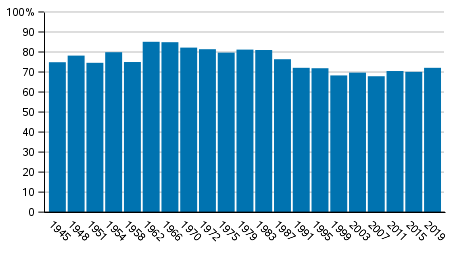
The voting percentage of Finnish citizens living in Finland was 72.1, which is 2.0 percentage points higher than in the previous Parliamentary elections. The voting turnout rose in all constituencies, in relative terms most in the constituencies of Pirkanmaa and Satakunta, by 3.2 percentage points. In Mainland Finland, the voting percentage was highest in the constituency of Helsinki (77.7%) and lowest in the constituency of Savo-Karelia (67.4%). Of municipalities in Mainland Finland, the voting percentage was lowest in Hyrynsalmi (60.0%) and highest in Luoto (86.2%).
The total number of persons entitled to vote in the Parliamentary elections was 4,510,040, of whom 4,255,466 were living in Finland and 254,574 abroad.
Voting turnout of Finnish citizens resident in Finland in Parliamentary elections 1945–2019, %
Women voted in the 2019 Parliamentary elections more actively than men, women's voting percentage was 73.5, or 2.9 percentage points higher than men’s voting percentage. Women have voted more actively than men in all Parliamentary elections since 1987. Advance voting increased its popularity in the Parliamentary elections 2019, as the share of advance voters in all who voted rose to over 50 per cent. Voting turnout also rose for those entitled to vote living abroad, as 12.6 per cent of persons entitled to vote living abroad voted in the 2019 Parliamentary elections, which is 2.5 percentage points higher than in the previous Parliamentary elections. Over 6,000 votes were given by post, as postal voting was allowed as a new method of voting in the 2019 Parliamentary elections.
Turnout by sex in Parliamentary elections 1945–2019 (Finnish citizens living in Finland), %
| Year | Total | Men | Women | Advance voters as percentage of all voters (Advance voting percentage) |
| 2019 | 72,1 | 70,6 | 73,5 | 50,7 |
| 2015 | 70,1 | 68,9 | 71,3 | 46,1 |
| 2011 | 70,5 | 69,6 | 71,3 | 45,0 |
| 2007 | 67,9 | 65,8 | 69,9 | 43,8 |
| 2003 | 69,7 | 67,6 | 71,6 | 37,3 |
| 1999 | 68,3 | 66,8 | 69,7 | 40,1 |
| 1995 | 71,9 | 70,6 | 73,1 | 43,2 |
| 1991 | 72,1 | 71,0 | 73,2 | 40,5 |
| 1987 | 76,4 | 76,2 | 76,6 | 15,3 |
| 1983 | 81,0 | 81,2 | 80,9 | 11,4 |
| 1979 | 81,2 | 81,9 | 80,6 | 9,6 |
| 1975 | 79,7 | 80,1 | 79,4 | 9,5 |
| 1972 | 81,4 | 81,9 | 81,0 | 6,3 |
| 1970 | 82,2 | 83,2 | 81,3 | 6,7 |
| 1966 | 84,9 | 86,1 | 83,9 | 3,8 |
| 1962 | 85,1 | 86,1 | 84,2 | 4,5 |
| 1958 | 75,0 | 78,3 | 72,1 | 6,0 |
| 1954 | 79,9 | 82,9 | 77,4 | 3,5 |
| 1951 | 74,6 | 78,4 | 71,4 | 5,6 |
| 1948 | 78,2 | 81,0 | 75,9 | 13,3 |
| 1945 | 74,9 | 77,5 | 72,7 | 13,0 |
Party analysis
The party analysis examines parties’ results in the Parliamentary elections 2019 with the help of various background variables in classified areas. Changes in the parties’ support are examined relative to the result of the previous Parliamentary elections. The voting districts whose borders have changed as little as possible since the previous elections are used as data. Small voting districts with fewer than 1,000 persons entitled to vote are combined so that the average size of a voting district is about 2,000 persons entitled to vote. The analysis is based on around 1,400 areas comparable to the previous elections.
The background variables used in the analysis are the area’s economic structure, degree of urbanisation, income level, unemployment rate and the number of pensioners. The background variables used are not mutually exclusive. For example, the area’s economic structure and degree of urbanisation also partially describe the area’s income level. (See the methodological description.)
In the Parliamentary elections 2019, the changes in support for the parties were relatively minor except for the Centre Party and the Green League. Apart from the aforementioned parties, the support percentages of the Parliamentary parties changed at most by 1.2 percentage points compared with the previous elections. This should be considered when interpreting changes in support. In practice, changes in parties’ support in different areas were on the whole minor, with the exception of the Centre Party and the Green League.
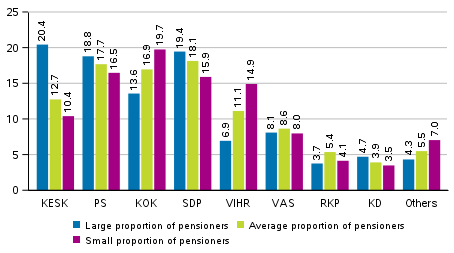
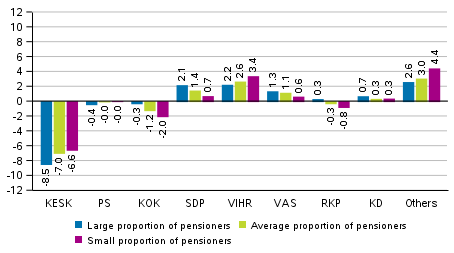
The support for the Centre Party was highest in areas where pensioners’ share of the population is big. The Centre Party also lost in relative terms its support most in areas with a large share of pensioners. The number of pensioners in the area has a positive effect on support for the Finns Party and the SDP and a negative effect on support for the Coalition Party and the Green League. Support for the Finns Party did not in practice change from the previous elections in areas limited by the number of pensioners, while the Coalition Party lost in relative terms its support most in areas where the number of pensioners is small. Correspondingly, support for the Social Democratic Party increased most in areas with more than average pensioners.
Support for the parties in the Parliamentary elections 2019 by the number of pensioners in specific geographical regions, %
Change in the support for the parties in the Parliamentary elections 2019 by the number of pensioners in specific geographical regions, %
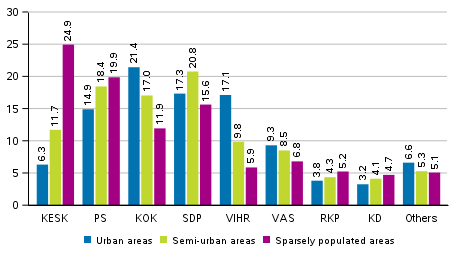
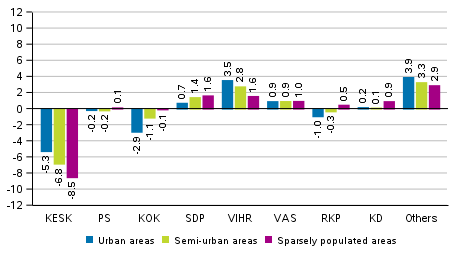
Support for the Centre Party was clearly focused on sparsely-populated areas, the party's support also decreased most in these areas in relative terms. The Finns Party’s support was particularly centred on population centres and sparsely-populated areas, support for the party did not in practice change in areas of different population densities from the previous elections. The support profile of the Coalition Party and the Green League is again similar, the strongest areas for both are urban areas. Support for the Coalition Party fell and for the Green League correspondingly rose most in urban areas.
Support for the Left Alliance was also focused on urban areas more than other areas, though less so than for the Coalition Party and the Greens. The Social Democratic Party’s support differs when examined with this indicator, the biggest support was reached in population centres that are less populated than urban areas.
Support for the parties in the Parliametary elections 2019 by areas specified by population density, %
Change in the support for the parties in the Parliametary elections 2019 by areas specified by population density, %
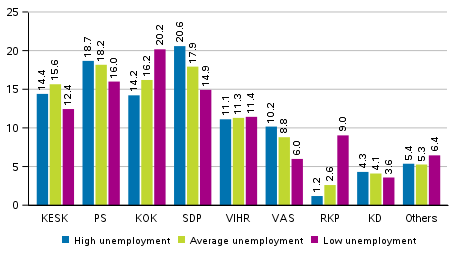
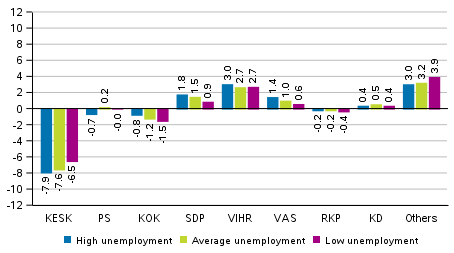
The Social Democratic Party and the Left Alliance and to a lesser degree also the Finns Party gained support in areas with higher than average levels of unemployment. For these parties, the differences in changes in support were small between areas. Support for the Coalition Party focused on areas of low unemployment, the party lost support fairly evenly in the examined areas. The number of unemployed persons appears not to have had an effect on the Greens’ support, the party also increased its support evenly in all areas. The Centre Party's support was biggest in areas with average levels of unemployment, the party lost support in all areas grouped by the unemployment rate, least in the areas with low levels of unemployment. Support for the Swedish People's Party clearly centred on areas of low levels of unemployment.
Support for the parties in the Parliamentary elections 2019 by areas specified by the unemployment rate, %
Change in the support for the parties in the Parliamentary elections 2019 by areas specified by the unemployment rate, %
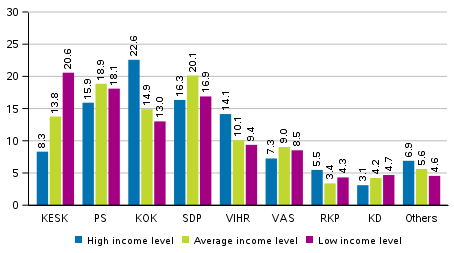
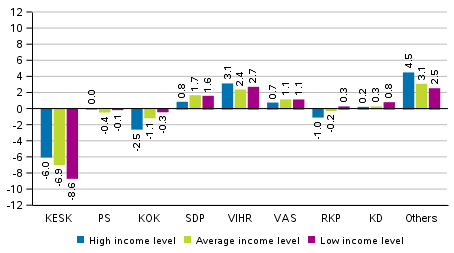
The Social Democratic Party's support is biggest in areas with average income level, the support profile of the Finns Party and the Left Alliance was also more or less similar to the SDP in this respect. Both the SDP and the Left Alliance increased their support in all areas, though relatively least in areas with high income level. Changes in support for the Finns Party were small in all areas grouped by the income level. Support for the Coalition Party and the Green League centred on areas with higher than average income level, the Coalition Party lost most votes in relative terms in these areas. Support for the Centre Party was highest in areas with low income levels, which is explained by lower income levels than average in agriculture-dominated and sparsely-populated areas.
Support for the parties in the Parliamentary elections 2019 by areas specified by the income level, %
Change in the support for the parties in the Parliamentary elections 2019 by areas specified by the income level, %
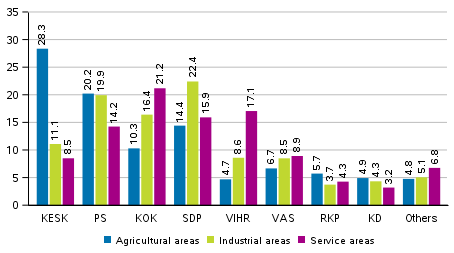
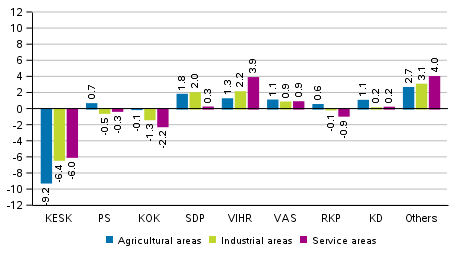
As expected, support for the Centre Party centred on areas where the economic structure is agriculture-dominated, the party’s support in industrial and service areas was clearly lower. The party lost votes in all areas, focusing on agriculture-dominated areas with biggest support for the party. Support for the Social Democratic Party was biggest in areas where the economic structure is industry, their support being clearly lower in agricultural and service areas. The SDP gained more support from agricultural and industrial areas, the party's support from service-dominated areas did not in practice change from the previous elections. Support for the Finns Party was strongest in agricultural and industrial areas, changes in the party's support were again very small.
Measured by the areas’ economic structure, the support profile of the Coalition Party and the Green League is also similar, while support for the Greens focused more on service areas than for the Coalition Party. The biggest changes in support for the parties also centre on service areas, the Greens’ support rose, and the Coalition Party's support fell in these areas. Support for the Left Alliance is relatively even in different areas, though slightly more in industrial and service areas. The party gained more support evenly in all areas grouped by service structure.
Support for the parties in the Parliamentary elections 2019 by areas specified by economic structure, %
Change in the support for the parties in the Parliamentary elections 2019 by areas specified by economic structure, %
Statistics Finland's election result services
Before the elections, Statistics Finland released a review on 5 April 2019 on the background of Parliamentary election candidates analysing the candidates' sex distribution, age, origin, education, employment, income level and family status in comparison to persons entitled to vote. The review will be updated on 29 April 2019 with background data on the elected MPs. The review on voting turnover will be published on 24 May 2019, which will examine voting turnout by means of unit-level background factors, such as age, sex, education and income.
Source: Parliamentary Elections 2019, Statistics Finland
Inquiries: Sami Fredriksson 029 551 2696, vaalit@stat.fi
Director in charge: Jari Tarkoma
Publication in pdf-format (571.7 kB)
- Tables
-
Tables in databases
Pick the data you need into tables, view the data as graphs, or download the data for your use.
Appendix tables
- Quality descriptions
-
- Parliamentary elections, quality description (24.4.2019)
Updated 24.4.2019
Official Statistics of Finland (OSF):
Parliamentary elections [e-publication].
ISSN=1799-6279. 2019. Helsinki: Statistics Finland [referred: 21.7.2026].
Access method: http://stat.fi/til/evaa/2019/evaa_2019_2019-04-24_tie_001_en.html