

Published: 8 December 2017
Finland's greenhouse gases made an upturn
In 2016, Finland's greenhouse gas emissions amounted to 58.9 million tonnes of carbon dioxide (CO2 eq.), being 12.4 million tonnes less than in the comparison year 1990. Emissions according to the instant preliminary data became revised by 0.1 tonnes. Total emissions rose by six per cent from the previous year, the biggest reasons for the growth in the emissions being the increase in coal consumption and the decline in the proportion of biofuels used in transport. Emissions from the non-emissions trading sector went up by six per cent compared to 2015 and exceeded the annual emission allocation set by the EU by 1.1 million tonnes of CO2 eq. The data are based on the preliminary report to be submitted by Statistics Finland to the European Commission by 15 January 2018 concerning emissions in 2016.
Greenhouse gas emissions of the emissions trading sector (ETS) and the non-emissions trading sector (non-ETS) by sector in 1990 to 2016 (million tonnes of CO2 eq.)
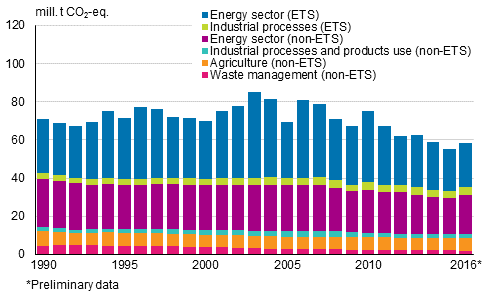
Total emissions in 2016 rose by six per cent from the previous year; emissions in the energy sector went up by eight per cent (3.3 million tonnes of CO2 eq.), emissions from industrial processes and product use increased by four per cent (0.3 million tonnes of CO2 eq.), emissions from agriculture grew by one per cent (0.04 million tonnes of CO2 eq.), and emissions in the waste sector went down by seven per cent (0.1 million tonnes of CO2 eq.). Emissions from transport (1.5 million tonnes of CO2 eq.) and from production of electricity and heat (1.4 million tonnes of CO2 eq.) rose most in the energy sector. Link to the energy release .
The removals of land use, land-use change and forestry sector (LULUCF) decreased by around six per cent compared to the previous year and amounted to around 27 million tonnes of CO2. This sector is not included in total emissions.
Greenhouse gas emissions and removals in the land use, land use change and forestry sector (LULUCF sector) in 1990 to 2016
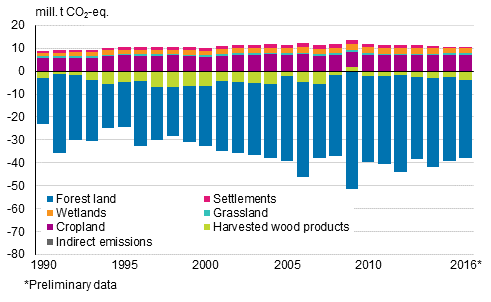
(Emissions are positive and removals negative figures)
Greenhouse gas emissions in Finland by sector
| 1990 | 1995 | 2000 | 2005 | 2010 | 2013 | 2014 | 2015 | 2016 4) | |
| Emissions and removals, million tonnes CO2 eq. | |||||||||
| Emissions without LULUCF sector 1) |
71.3 | 71.9 | 70.1 | 69.8 | 75.5 | 63.1 | 58.9 | 55.4 | 58.9 |
| Energy sector | 53.6 | 55.3 | 53.8 | 53.7 | 60.2 | 48.3 | 44.5 | 40.9 | 44.2 |
| Energy industries | 19.0 | 24.0 | 22.1 | 22.1 | 30.9 | 22.2 | 21.0 | 17.8 | 19.1 |
|
Manufacturing industries and construction |
13.7 | 12.4 | 12.2 | 11.6 | 10.2 | 8.6 | 7.2 | 6.9 | 7.3 |
| Transport | 12.1 | 11.3 | 12.1 | 12.9 | 12.7 | 12.2 | 11.1 | 11.1 | 12.6 |
| Other energy 2) | 8.8 | 7.6 | 7.3 | 7.0 | 6.3 | 5.4 | 5.2 | 5.0 | 5.2 |
| Industrial
processes and products use |
5.4 | 5.0 | 6.0 | 6.7 | 6.1 | 5.9 | 5.7 | 5.9 | 6.1 |
|
Industrial
processes (excl. F-gases ) 3) |
5.3 | 4.9 | 5.2 | 5.6 | 4.7 | 4.4 | 4.2 | 4.4 | 4.7 |
|
Consumption of F-gases 3) |
0.1 | 0.2 | 0.7 | 1.1 | 1.4 | 1.5 | 1.5 | 1.5 | 1.4 |
| Agriculture | 7.5 | 6.8 | 6.5 | 6.5 | 6.6 | 6.5 | 6.5 | 6.5 | 6.5 |
| Waste management | 4.7 | 4.6 | 3.9 | 2.8 | 2.6 | 2.3 | 2.2 | 2.1 | 2.0 |
| Indirect CO2 emissions | 0.2 | 0.1 | 0.1 | 0.1 | 0.1 | 0.1 | 0.1 | 0.1 | 0.1 |
| LULUCF sector 5) | -14.0 | -13.7 | -22.4 | -27.7 | -27.5 | -27.3 | -30.9 | -28.8 | -27.1 |
2) Other energy includes sub-categories heating of buildings, fuel use in agriculture, forestry and fisheries, other fuel use and fugitive emissions from fuels.
3) F-gases refer to fluorinated greenhouse gases (HFC, PFC compounds, SF6 and NF3)
4) Preliminary data
5) Negative figures are removals of greenhouse gases
Emissions outside the non-emissions trading scheme emissions are calculated as the difference between the total emissions and verified emissions of the emissions trading sector, excluding CO2 emissions from domestic civil aviation according to the inventory. The data on the verified emissions of the emissions trading sector are published by the Energy Authority. Annual emission allocations for the years 2013 to 2020 have been defined in the EU's effort sharing decision for emissions from the non-emissions trading sector. Emissions from the non-emissions trading sector are below the annual emission allocations in 2013 to 2015. Emissions according to the preliminary data for 2016 exceeded the target path. More information in Finnish is available in the Review of the release .
Greenhouse gas emissions broken down between emissions trading sources and non-emissions trading sectors in 2005, 2008 to 2010, and 2013 to 2016 (million t CO2 eq.)
| 2005 | 2008 | 2009 | 2010 | 2013 | 2014 | 2015 | 2016 3) | Change, 2015-2016 | |
| Emissions without LULUCF sector | 69.8 | 71.3 | 67.7 | 75.5 | 63.1 | 58.9 | 55.4 | 58.9 | -3.5 |
| CO2 emissions from civil aviation | 0.3 | 0.3 | 0.2 | 0.2 | 0.2 | 0.2 | 0.2 | 0.2 | 0.0 |
| Emissions trading sector emissions 1) | 33.1 | 36.2 | 34.4 | 41.3 | 31.5 | 28.8 | 25.5 | 27.2 | -1.8 |
| Non-emissions trading sector emissions 2) | 36.4 | 34.9 | 33.1 | 34.0 | 31.4 | 29.9 | 29.7 | 31.4 | -1.7 |
2) Excluding CO2 emissions from domestic civil aviation according to the inventory
3) Preliminary data
Source: Greenhouse gas inventory unit. Statistics Finland
Inquiries: Riitta Pipatti 029 551 3543, Pia Forsell 029 551 2937, kasvihuonekaasut@stat.fi
Director in charge: Ville Vertanen
Publication in pdf-format (193.9 kB)
- Tables
-
Tables in databases
Pick the data you need into tables, view the data as graphs, or download the data for your use.
- Revisions in these statistics
-
- Revisions in these statistics (8.12.2017)
Updated 8.12.2017
Official Statistics of Finland (OSF):
Greenhouse gases [e-publication].
ISSN=1797-6065. 2016. Helsinki: Statistics Finland [referred: 21.7.2026].
Access method: http://stat.fi/til/khki/2016/khki_2016_2017-12-08_tie_001_en.html