

Published: 1 November 2018
Use of renewable energy sources grew in electricity and heat production in 2017
The production of electricity in Finland amounted to 67.7 TWh in 2017, which was slightly less than in the year before. The amount of electricity produced with renewable energy sources grew by 1.1 TWh to the value of 30.7 TWh, which is 45 per cent of total electricity production. The production of district heat remained on level with the previous year, but the production of industrial heat grew by 0.8 per cent. The use of renewable energy sources grew clearly in the production of district and industrial heat. The use of fossil fuels decreased in the production of electricity and district heat by 12 per cent. The use of peat fell by around five per cent. These data derive from the statistics on the production of electricity and heat compiled by Statistics Finland.
Electricity generation by energy source 2000-2017
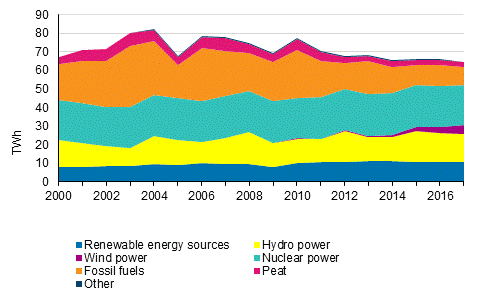
In 2017, the production of electricity in Finland amounted to 65.0 terawatt hours (TWh) or one billion kilowatt hours (kWh). The production decreased slightly from the year before. However, total electricity consumption remained on level with the previous year, at 85.5 TWh. Of total electricity consumption, 76 per cent was covered by domestic production and 24 per cent by net imports of electricity from the Nordic countries, Russia and Estonia. Net imports of electricity grew by 7.8 per cent from the year before. Thirty-two per cent of domestic electricity production was based on combined heat and power production.
The electricity produced by hydro power amounted to 14.6 TWh, which is slightly less than in the year before. The share of hydro power in electricity production varies yearly according to the water situation. The volume of electricity produced with renewable energy sources amounted to 39.7 TWh. Renewable energy sources accounted for 47 per cent of electricity production. Nearly one-half of the electricity produced with renewable energy sources was produced with hydro power, 16 per cent with wind power and almost all of the remainder with wood-based fuels. Fifteen per cent of electricity was produced with fossil fuels, four per cent with peat and 33 per cent with nuclear power.
The amount of electricity produced with renewable energy sources grew in 2017 despite the fact that the amount of electricity produced with hydro power decreased by nearly seven per cent. The growth in the total amount of electricity produced with renewable energy sources was largely caused by wind power production, which grew by as much as 56 per cent. The amount of electricity produced with wood-based fuels grew by 3.5 per cent. The amount of electricity produced with fossil fuels declined by 13 per cent from the year before, as the amount produced with hard coal decreased by 16 per cent and that produced with natural gas by 12 per cent. The use of fossil fuels varies yearly particularly according to the use of hard coal. Over the past few years, their use has in total decreased and the use of renewable fuels has correspondingly increased. The amount of electricity produced with peat decreased by five per cent from the year before.
Electricity and heat production and fuels used by production mode in 2017
| Electricity, GWh | District heat, GWh | Industrial heat, GWh | Fuels used, TJ 1) | |
| Separate production of electricity | ||||
| - Hydro power | 14 610 | .. | .. | .. |
| - Wind power | 4 795 | .. | .. | .. |
| - Solar power | 44 | .. | .. | .. |
| - Nuclear power | 21 574 | .. | .. | .. |
| - Condensing power 2) | 3 284 | .. | .. | 36013 |
| - Total | 44 307 | .. | .. | 36 013 |
| Combined heat and power production | 20 735 | 24 659 | 43 821 | 394 653 |
| Separate heat production | .. | 13 632 | 9 834 | 84 518 |
| Total production | 65 042 | 38 292 | 53 655 | 515 184 |
| Net imports of electricity | 20 426 | .. | .. | .. |
| Total | 85 468 | 38 292 | 53 655 | 515 184 |
2) Condensing power includes condensing power plants, shares of condensing electricity of combined heat and power production plants, and peak gas turbines and similar separate electricity production plants.
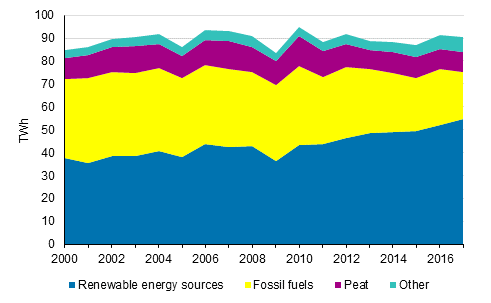
The production of district heat totalled 38.3 TWh in 2017, being thus on level with the previous year. The use of renewable fuels in the production of district heat grew by six per cent from the year before. In turn, the use of fossil fuels diminished by eight per cent. Clearly under one-half of district heat was produced with fossil fuels. Most of district heat was produced with wood fuels (33%) and hard coal (23%). Peat retained its position as the third most important energy source in district heat production; 14 per cent of district heat was produced with peat. Heat recovery of flue gas scrubbers has grown considerably in recent years. They produced six per cent of district heat in 2017.
The production of industrial heat was 53.7 TWh in 2017. The production went up slightly from the year before. One-half of heat produced for the needs of manufacturing comes from black liquor. In all, 75 per cent of the production of industrial heat was based on renewable fuels. One of the biggest users of industrial heat is the forest industry, which uses its own fuels in production, like black liquor and other wood fuels. In the chemical and metal industries, part of the use of heat is considered as direct fuel use, and is thus not visible in the production figures on heat.
District heat and industrial heat production by fuels 2000-2017
The statistics on the production of electricity and heat cover the entire production of electricity connected to the grid. The coverage of the statistics has been improved by adding district heat production plants. Therefore, the figures are not fully comparable with the statistics for previous years. Solar power and small CHP produced with biogas are also included in the statistics. From 2015 onwards, the statistics also cover small heat plants, that is, all production of district heat. The statistics do not cover all industrial heat and producers of so-called local heating.
Links:
Statistics Finland's electricity and heat production inquiry
Finnish Energy Industries
https://energia.fi/en/news_and_publications/statistics/electricity_statistics
Statistics Finland's electricity and heat production inquiry
Source: Statistics on production of electricity and heat, Statistics Finland and Electricity statistics, Finnish Energy Industries
Inquiries: Pekka Lösönen 029 551 3268, Minna Niininen 029 551 3549, energia@stat.fi
Director in charge: Ville Vertanen
Publication in pdf-format (355.5 kB)
- Tables
-
Tables in databases
Pick the data you need into tables, view the data as graphs, or download the data for your use.
Appendix tables
- Figures
-
- Appendix figure 1. Electricity generation by energy source 2017 (1.11.2018)
- Appendix figure 2. Electricity generation with renewables 2017 (1.11.2018)
- Appendix figure 3. Electricity generation by production mode 2000-2017 (1.11.2018)
- Appendix figure 4. Electricity generation with renewables 2000-2017 (1.11.2018)
- Appendix figure 5. District heat production by fuels 2000-2017 (1.11.2018)
- Appendix figure 6. Industrial heat production by fuels 2000-2017 (1.11.2018)
- Appendix figure 7. Fuel use in separate electricity production 2016-2017 (1.11.2018)
- Appendix figure 8. Fuel use in combined heat and power production 2016-2017 (1.11.2018)
- Appendix figure 9. Fuel use in separate heat production 2016-2017 (1.11.2018)
Updated 1.11.2018
Official Statistics of Finland (OSF):
Production of electricity and heat [e-publication].
ISSN=1798-5099. 2017. Helsinki: Statistics Finland [referred: 26.5.2026].
Access method: http://stat.fi/til/salatuo/2017/salatuo_2017_2018-11-01_tie_001_en.html