

1. Sector-specific review on the data for the fourth quarter of 2012
1.1. Households' disposable income has grown slightly
The disposable income of households grew in the fourth quarter of 2012 by EUR 0.5 billion, or nearly two per cent compared to the corresponding quarter in 2011. The key components of disposal income on the income side are wages, salaries, entrepreneurial income and property income and social benefits received. The biggest expense items are taxes paid and social contributions.
Figure 1. Components of household sector adjusted disposable income
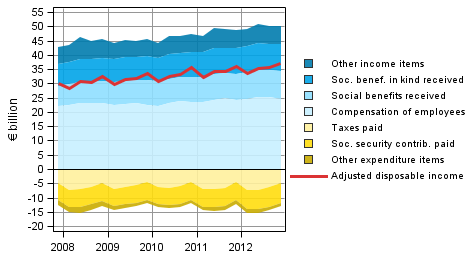
Compared to the figures one year ago, the income improved in particular due to a EUR 0.5 billion increase in wages and salaries and a EUR 0.6 billion increase in social benefits. The single expense item that had grown most was income taxes, EUR 0.6 billion more was paid in income taxes than one year ago.
When received social benefits in kind are added to the disposable income of households, the household adjusted disposable income is derived, which is the indicator recommended by the OECD for measuring economic well-being. Social benefits in kind refer, for instance, to education, health and social services. The adjusted disposable income grew by 2.2 per cent compared to the corresponding quarter last year. One-third of this is explained by growth in social transfers in kind.
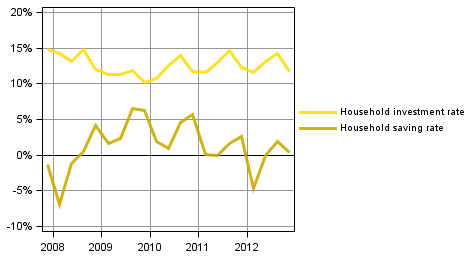
In the last quarter of 2012, households' saving rate was 0.3 per cent of the disposable income. One year ago, the saving rate was 2.6 per cent. The saving rate is derived by deducting consumption expenditure from disposable income. The saving rate can be negative if households' consumption expenditure is higher than the disposable income. In the fourth quarter of 2012, the investment rate of households accounted for 11.8 per cent of disposable income. One year ago, the investment rate was 12.3 per cent. Most of households' investments were investments in dwellings.
Figure 2. Households' indicators
Wages and salaries paid by non-profit institutions serving households decreased by half-a-per-cent from one year ago.
In this statistics, the households sector only covers the actual households sector S14. Sector S15, non-profit institutions serving households is calculated and published separately. The households sector in Eurostat’s publications also includes the data for sector S15. Another difference is that Eurostat publishes investment and savings rates as gross figures, i.e. including consumption of fixed capital. This statistics uses net data, i.e. consumption of fixed capital has been removed from the figures.
1.2. Enterprises' profit share and investment rate contracted
In the last quarter of 2012, the profit share of non-financial corporations, or the share of profits in value added, was 32.9 per cent. One year previously, the corresponding figure was 33.7 per cent. Compared to the figures from last year, the profit share of non-financial corporations has been 1-2 percentage points lower in 2012 in all quarters. The profit share is mainly determined based on the development of value added. Compensation of employees develop more evenly so the fluctuations in value added are visible in profits.
Figure 3. Non-financial corporations' indicators
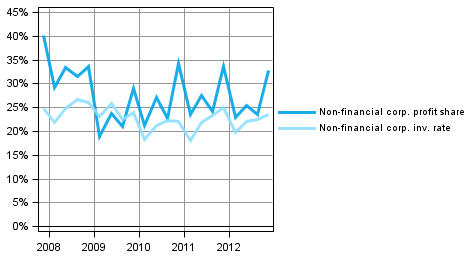
The investment rate of non-financial corporations, or the proportion of fixed capital investments in value added, also decreased in the last quarter of 2012. In the fourth quarter of 2012, the investment rate was 23.6 per cent while the corresponding figure one year ago was 25.1 per cent.
The low general level of interest rates still affects the financial and insurance sector. The property income in the sector were 23 per cent lower in the last quarter and property expenditure was 17 per cent lower than one year ago. Low interest rates weaken credit institutions' net interest income. Even though the weakened net interest income has been compensated through other financial services, the gross value added of the sector decreased by nearly one per cent from last year. As nearly three per cent more compensation of employees were paid than last year, the operating surplus that depicts profits was slightly under 10 per cent lower than a year ago. Holding gains and losses generated through own securities trading are not visible in the operating surplus and profit share; they describe the income that is generated from offering financial services to the public.
Net lending by enterprises and financial institutions has been positive over the past few years. This means that the sectors as a whole have financed their investments with their own surplus and also granted credits to other sectors. When reviewing moving averages, net lending of the non-financial corporations sector has been around three per cent of GDP and net lending of the financial corporations sector has been around one per cent of GDP. During 2012, net lending of the non-financial corporations sector has grown clearly. This is primarily due to destocking.
1.3. General government deficit was as high as one year previously in the fourth quarter
General government unconsolidated total revenue was EUR 0.7 billion higher than a year ago. Total expenditure also grew by EUR 0.7 billion. General government is comprised of central government, local government and social security funds. Unconsolidated total revenue and expenditure refers to flows from which mutual sub-sector items have not been eliminated.
Figure 4. Components of general government sector net lending
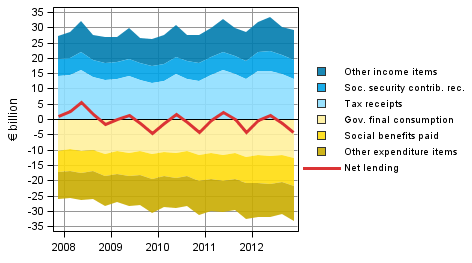
The general government deficit (net lending) formed as a difference between the total revenue and expenditure was at the same level as one year previously. On the revenue side, the financial position of general government was improved by the income tax revenue which was EUR 0.2 billion higher. EUR 0.6 billion more was paid in social benefits than one year ago, while only EUR 0.3 billion more was collected in social security contributions. Of the sub-sectors, central government deficit was lower than one year previously while the deficit of local government increased. The surplus of social security funds decreased. More detailed statistics, where the sub-sectors are specified, is published in the quarterly sector accounts of general government: http://www.stat.fi/til/jtume/index_en.html .
In general government, the calculation method for social security contributions received by employment pension schemes (D61R) was changed in order to better achieve accrual basis in the quarterly distribution of the contributions. The methodological change affects the quarterly distribution of the time series but not the annual level data.
1.4. Foreign trade showed a deficit in the fourth quarter
The essential items for the rest of the world sector are the exports and imports of goods and services. Exports of goods and services at current prices amounted to EUR 19.8 billion in the fourth quarter of 2012. Exports of goods decreased by EUR 0.1 billion and that of services went down EUR 0.2 billion from the corresponding quarter last year.
Figure 5. Components of the balance of goods and services in foreign trade (from the perspective of the rest-of-the-world sector)
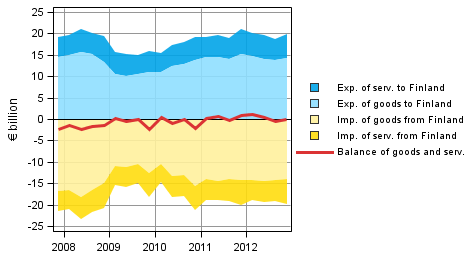
Note: Figures may differ from Bank of Finland's balance of payments figures due to differences in compilation schedules. This regards especially the latest quarters.
Imports to Finland at current prices were EUR 19.9 billion in the last quarter. In total, the value of imports fell by EUR 1.2 billion from the fourth quarter in 2011. Imports of goods fell by EUR 0.9 billion and imports of services went down EUR 0.3 billion.
The balance for goods and services, which is the difference between imports and exports, showed a deficit of approximately EUR 0.1 billion in the last quarter of 2012.
1.5. Data and methods used
The quarterly data become revised as source data are updated. The biggest revision will take place for the last 2-3 years, because the data in the annual accounts are still preliminary. The data in the publication are based on the data sources available by 20 March 2013. The data for 1999 to 2011 correspond with the annual sector accounts of the National Accounts. The central government data for 2012 will be slightly revised during March which will cause small differences in the annual accounts data release from 1 March 2013.
The savings rate, profit share and investment rate in the quarterly publication of sector accounts are net amounts, i.e. consumption of fixed capital has been removed from the figures. The key indicators in this statistics have been calculated as follows:
Households' saving rate = B8N / (B6N+D8R)
Households' investment rate = P51K / (B6N+D8R)
Profit share of non-financial corporations = B2N / B1NPH
Investment rate of non-financial corporations = P51K / B1NPH
Source: Sector accounts, Statistics Finland
Inquiries: Jesse Vuorinen 09 1734 3363, Erkki L��k�ri 09 1734 3355, skt.95@stat.fi
Director in charge: Leena Storg�rds
Updated 28.3.2013
Official Statistics of Finland (OSF):
Quarterly sector accounts [e-publication].
ISSN=2243-4992. 4th quarter 2012,
1. Sector-specific review on the data for the fourth quarter of 2012
. Helsinki: Statistics Finland [referred: 14.12.2025].
Access method: http://stat.fi/til/sekn/2012/04/sekn_2012_04_2013-03-28_kat_001_en.html