Published: 8 June 2021
One-half of households had a net wealth of over EUR 104,000 in 2019
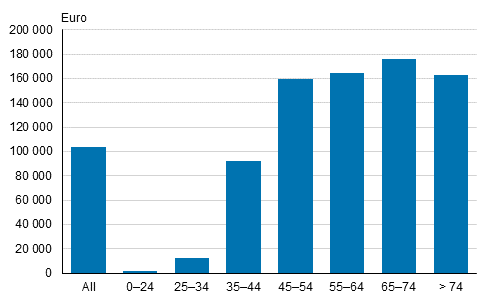
Statistics Finland's Households' assets -statistics for 2019 indicates that the median for households' net wealth was EUR 104,000 in 2019. One-quarter of households had a net wealth of over EUR 257,900 and one-quarter under EUR 9,400. Households of those aged 65 to 74 were the wealthiest.
Average net wealth (= assets – liabilities) according to the age of the household's reference person in 2019, median

The average net wealth was around EUR 214,800 per household or over double compared to the median. The ratio describes wealth concentration on the highest-income decile that owned some 50 per cent of net wealth in 2019. The five least wealthy deciles, or one-half of households, owned around five per cent of net wealth.
Distribution of net wealth in 1988, 1998, 2009, 2016 and 2019, shares of total amount of net wealth (%)
| Net wealth decile group | 1988 | 1998 | 2009 | 2016 | 2019 |
| I–V (least wealthy 50 %) | 10.2 | 7.0 | 6.4 | 6.1 | 5.4 |
| VI | 8.7 | 7.5 | 6.9 | 6.5 | 6.0 |
| VII | 11.2 | 9.8 | 9.7 | 9.2 | 8.6 |
| VIII | 14.4 | 13.4 | 13.6 | 12.7 | 12.1 |
| IX | 19.1 | 18.9 | 19.4 | 18.8 | 18.3 |
| X (wealthiest 10 %) | 36.6 | 43.3 | 43.9 | 46.8 | 49.6 |
| Total | 100 | 100 | 100 | 100 | 100 |
Differences in wealth increased from 2016 to 2019, as the share of net wealth of the highest-income decile grew. Compared with the statistical year 1988, the wealth share of the wealthiest decile has risen clearly. Due to methodological changes in the statistics, the best figures for comparison over time are the main asset items, such as net wealth and total assets. Starting from the statistical year 2009, wealth data have mainly been derived from registers or estimated. Previous surveys are face-to-face interview surveys.
The net wealth of the wealth survey is obtained by adding up real and financial assets and by deducting debts from them. Households’ most commonly owned asset type was deposits, which nearly all households had (98% of households). The next most commonly owned were transport equipment (72% of households), own dwelling (65%) and listed shares and mutual funds (43%). Measured by the value of the asset, one’s own dwelling was clearly the biggest asset item as its share of total assets was around one-half (48% of total assets). The next most significant asset item was other dwellings, whose share of total assets was one tenth (10% of total assets).
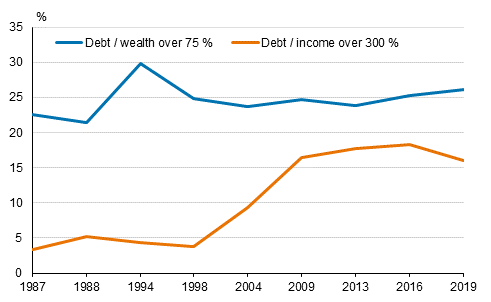
Three households out of five had debts (59%). For around 16 per cent of the indebted households, the amount of debt was more than triple compared to the annual income in 2019. Households whose rate of indebtedness was over 300 per cent represented only a few per cent of indebted households at the end of the 1990s. By contrast, if large debts are measured by the ratio of debts to total assets and the limit for large debts is set at 75 per cent, the share of large debts has remained almost unchanged since the end of the 1990s. In 2019, the amount of debt exceeded 75 per cent of the household's assets for around one in four indebted households (26 per cent).
Households with large debts in proportion to income or assets in 1987 to 2019, % of indebted households

Around six per cent of households experienced credit tightening in 2019. Based on collected data, a household is classified as a household with credit tightening if it a) has applied for a loan in the past three years preceding the interview and did not receive a loan immediately or later, b) has applied for a loan but received a lower amount than applied for, or c) has not applied for a loan for fear of not receiving it.
Source: Households' assets
Inquiries: Tara Junes 029 551 3322, Samuel Ikonen 029 551 3086, Ville Pakkanen 029 551 3485
Head of Department in charge: Hannele Orjala
Publication in pdf-format (174.7 kB)
- Tables
-
Tables in databases
Pick the data you need into tables, view the data as graphs, or download the data for your use.
Updated 8.6.2021
Official Statistics of Finland (OSF):
Households' assets [e-publication].
ISSN=2242-3230. 2019. Helsinki: Statistics Finland [referred: 1.2.2026].
Access method: http://stat.fi/til/vtutk/2019/vtutk_2019_2021-06-08_tie_001_en.html

